



 12 min read
 Published
A B2B customer journey map is a visual of how a business customer moves from recognizing a problem to buying, adopting and renewing your product. It lays out each stage, the touchpoints and the pain points, and because B2B purchases involve several people, the best maps show each role in its own lane.
I’m Maniruzzaman Jubayer, Co-founder & COO and Product Design Specialist at Wolfpixel, with 7 years of experience. Journey mapping is part of the UX research we run for B2B and SaaS products. Most guides on this topic come from marketing teams, so they stop at the purchase. This one covers the whole journey, including the product touchpoints where B2B accounts are actually kept or lost, and gives you a template you can copy.
The short answer: to build a B2B customer journey map, define one scenario, list the roles in the buying group, gather evidence from interviews, CRM and product data, lay out stages from trigger to renewal, plot each role’s actions and pain points, and turn what you find into a ranked list of fixes with owners.
Key takeaways:
- B2B buying is a group decision. Gartner reports buying groups of five to 16 people across up to four functions.
- Map by role, not by one persona. The champion, the budget owner and IT are on different journeys.
- For SaaS, most of the value sits after the sale: onboarding, adoption and renewal.
- Build it from evidence. Mark every cell as observed or assumed.
- A map is only useful if it ends in a ranked list of fixes with owners and metrics.
How we wrote this: we reviewed the pages ranking for this topic in November 2026, including Coveo, HubSpot, Miro, Salesforce and B2B International, and read the Gartner and Nielsen Norman Group sources behind them. Figures are linked to the original publisher. The role lanes, stage model and template are our own, based on how we map B2B products, and we label them that way. The full list is in Sources and method.
What is a B2B customer journey map?
Nielsen Norman Group defines a journey map as a visualization of the process that a person goes through in order to accomplish a goal. A B2B customer journey map applies that to a business purchase and the relationship that follows.
It usually combines:
- Stages, from the first trigger to renewal.
- Actors, the people involved at each stage.
- Actions and thoughts, what each person does and wonders.
- Touchpoints, where they meet your company: website, sales, product, support, invoices.
- Pain points and opportunities, where the journey breaks and what you could do about it.
Journey map vs service blueprint
The two are often confused. A journey map shows the experience from the customer’s side. A service blueprint shows what happens inside your company to deliver it, including frontstage and backstage actions and support processes. Nielsen Norman Group calls the blueprint a part two to customer journey maps. Start with the journey map. Add a blueprint when you need to fix the internal cause of a problem the map revealed.
Why B2B journeys need a different map
Most journey map templates were built for consumers: one person, one decision, a fairly straight path. B2B breaks all three.
- Many people decide. In a 2025 survey of 632 B2B buyers, Gartner found that buying groups range from five to 16 people across as many as four functions, and 74% of buyer teams showed unhealthy conflict during the decision.
- Buyers research on their own. In a survey of 646 B2B buyers published in 2026, Gartner found that 67% prefer a rep-free experience and 45% had used AI during a recent purchase. Much of the journey happens before you know a buyer exists.
- The journey doesn’t end at the contract. For subscription software, onboarding, adoption and renewal decide most of the revenue. A map that stops at “closed won” misses the part of the journey you can most directly design.
Nielsen Norman Group makes a related point: in some B2B products, the word “customer” fits badly, because the end user isn’t the person who bought the product. That is why the map below uses roles, not one persona.
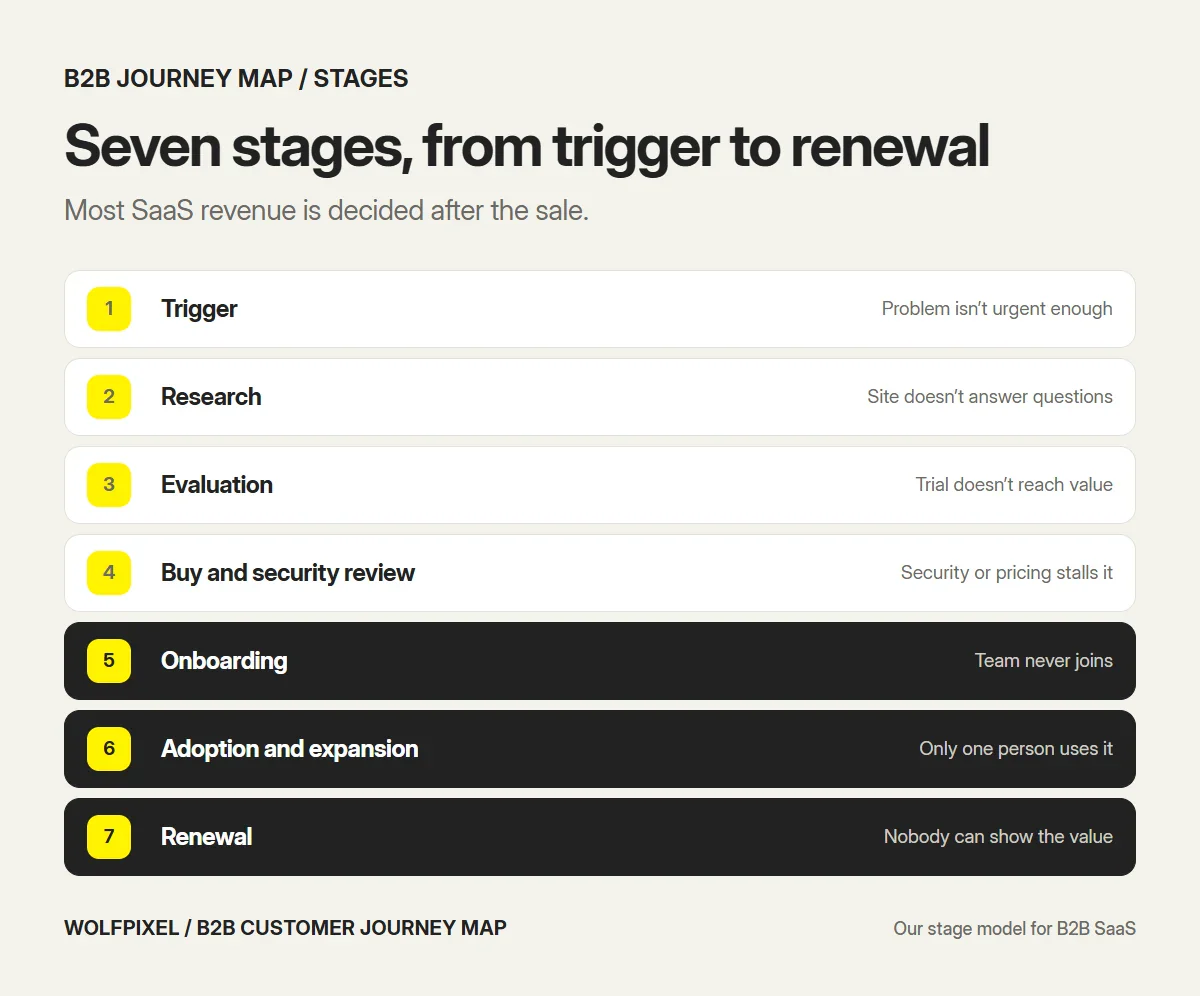
The stages of a B2B SaaS customer journey
The common five-stage model (awareness, consideration, decision, retention, advocacy) is a reasonable start. For B2B SaaS we split it further, because the stages after purchase are where most of the product work happens.
| Stage | What the buying group is doing | Where it usually breaks |
|---|---|---|
| 1. Trigger | Recognizing a problem worth solving | The problem isn’t urgent enough to act on |
| 2. Research | Searching, asking peers, reading reviews, using AI | Your site doesn’t answer their questions |
| 3. Evaluation | Comparing vendors, booking demos, starting trials | The trial doesn’t reach value fast enough |
| 4. Buy and security review | Building the business case, IT review, procurement | Security questions or pricing stall the deal |
| 5. Onboarding | Setting up, inviting the team, importing data | Setup is too heavy, the team never joins |
| 6. Adoption and expansion | Using it daily, adding users or plans | Only one person uses it, value stays invisible |
| 7. Renewal | Deciding whether to keep paying | Nobody can show what the product achieved |
Map by role, not by persona
This is the biggest difference between a useful B2B map and a decorative one. Instead of one persona, give each role in the buying group its own lane. These are the lanes we use most often.
| Role | What they need from the journey | Typical stall point |
|---|---|---|
| End user | A tool that makes their daily work easier | The trial or onboarding feels like extra work |
| Champion | Proof the product solves the problem, and material to sell it internally | Can’t explain the value to the budget owner |
| Economic buyer | A business case and acceptable risk | Unclear return on investment or pricing |
| IT and security | Security, compliance, integrations, SSO | Slow or missing answers to the security review |
| Procurement or finance | Clear terms, invoices, vendor information | Non-standard contracts or surprise costs |
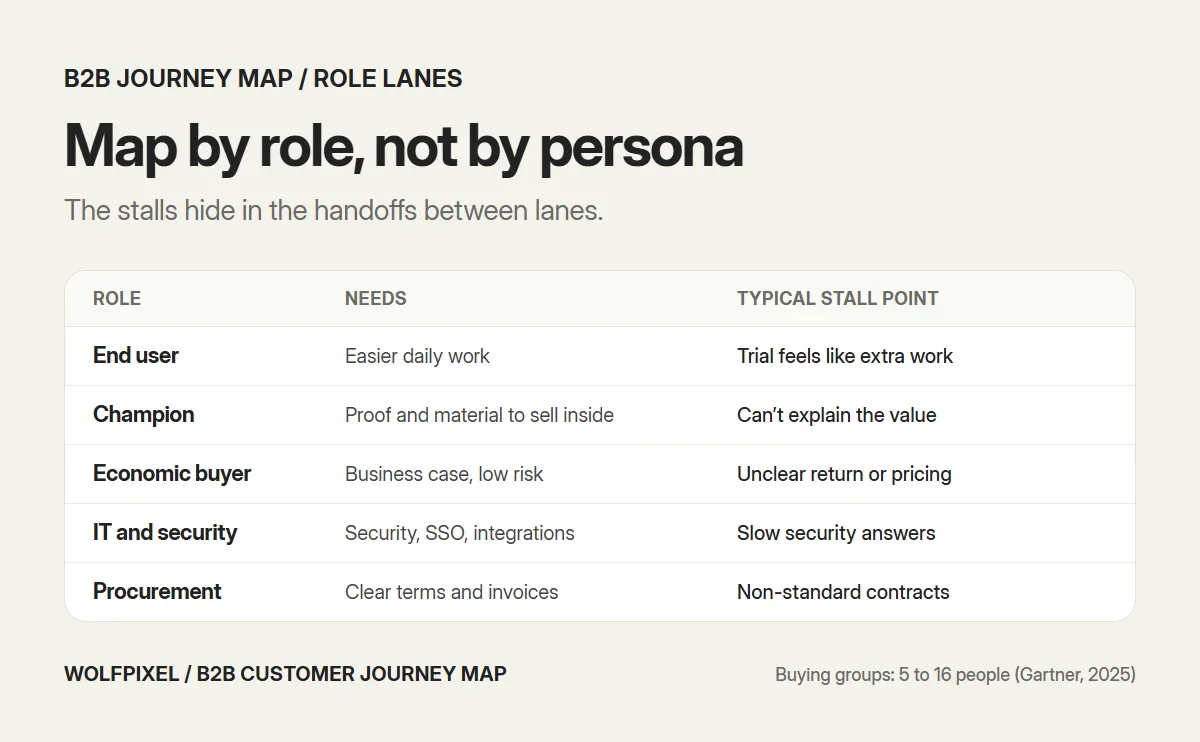
The value of lanes shows up at the handoffs. A champion might love your trial in stage 3 and then wait three weeks for a security questionnaire in stage 4. On a single-persona map, that delay is invisible. On a role map, it is the most obvious problem on the page.
The product touchpoints most maps miss
Marketing-led maps list ads, emails and sales calls. For a SaaS product, many of the moments that decide the journey happen inside the product. Add these rows to your map:
- Pricing page during research and evaluation.
- Signup and first session, including what a new account sees when it has no data.
- Team invites, the moment a single user becomes a team.
- Admin setup: roles, permissions and SSO.
- In-app guidance and help content during onboarding.
- Billing and invoices, which finance sees even if nobody else does.
- Renewal notices and any usage report that proves value before the contract ends.
We cover the design side of these touchpoints in our guide to B2B SaaS UX, and the first-session details in SaaS user onboarding. Our SaaS product design service designs these touchpoints as one product.
How to build a B2B customer journey map in 7 steps
- Set the goal and scope. One product, one segment, one scenario, such as “mid-market team buying for the first time.” A map of everything is a map of nothing.
- Choose the roles. List who can move or stop the deal and the account. Start with the five lanes above and add or remove based on your deals.
- Gather evidence. Interview won, lost and churned customers, with each role where you can. Pull CRM stage data and call notes, product analytics, support tickets and renewal records.
- Define the stages. Adapt the seven stages above to how your customers actually buy.
- Plot each lane. For every role and stage, write down what they do, what they think and which touchpoint they use. Mark each cell as observed or assumed.
- Find the pain points. Look for stalls, handoffs and drops in the data. Mark the moments of truth, where a good or bad experience changes the outcome.
- Turn it into fixes. List the opportunities, score them, give each an owner and a metric, and decide what to do first.
Where the evidence comes from
| Source | What it tells you | Watch out for |
|---|---|---|
| Customer interviews | Why people acted, in their words | Small samples, memory bias |
| Lost-deal interviews | Why deals stalled or went elsewhere | Hard to schedule, so start early |
| CRM stage data | Where deals slow down and for how long | Stages entered inconsistently by sales |
| Product analytics | Where trials and new accounts drop | Shows what happened, not why |
| Support tickets | Where customers get stuck after buying | Skews toward the loudest customers |
| Renewal and churn records | Which accounts leave and when | Reasons are often vague |
Combine at least one source that tells you what happened with one that tells you why. Interviews alone give you stories. Data alone gives you numbers without causes. Once interviews have found a pain point, a short survey tells you how many accounts share it. Our UX survey guide covers the questions and sample sizes, and our guide to a UX research strategy shows how to keep this evidence coming in after the map is done.
Free B2B customer journey map template
Copy this structure into a spreadsheet, FigJam or Miro board. Stages go across the top. Roles and the supporting rows go down the side.
| Row | Trigger | Research | Evaluation | Buy and review | Onboarding | Adoption | Renewal |
|---|---|---|---|---|---|---|---|
| Goal at this stage | |||||||
| End user | |||||||
| Champion | |||||||
| Economic buyer | |||||||
| IT and security | |||||||
| Procurement or finance | |||||||
| Touchpoints | |||||||
| Emotion (high, mid, low) | |||||||
| Pain points | |||||||
| Evidence and confidence | |||||||
| Metric | |||||||
| Opportunity | |||||||
| Owner |
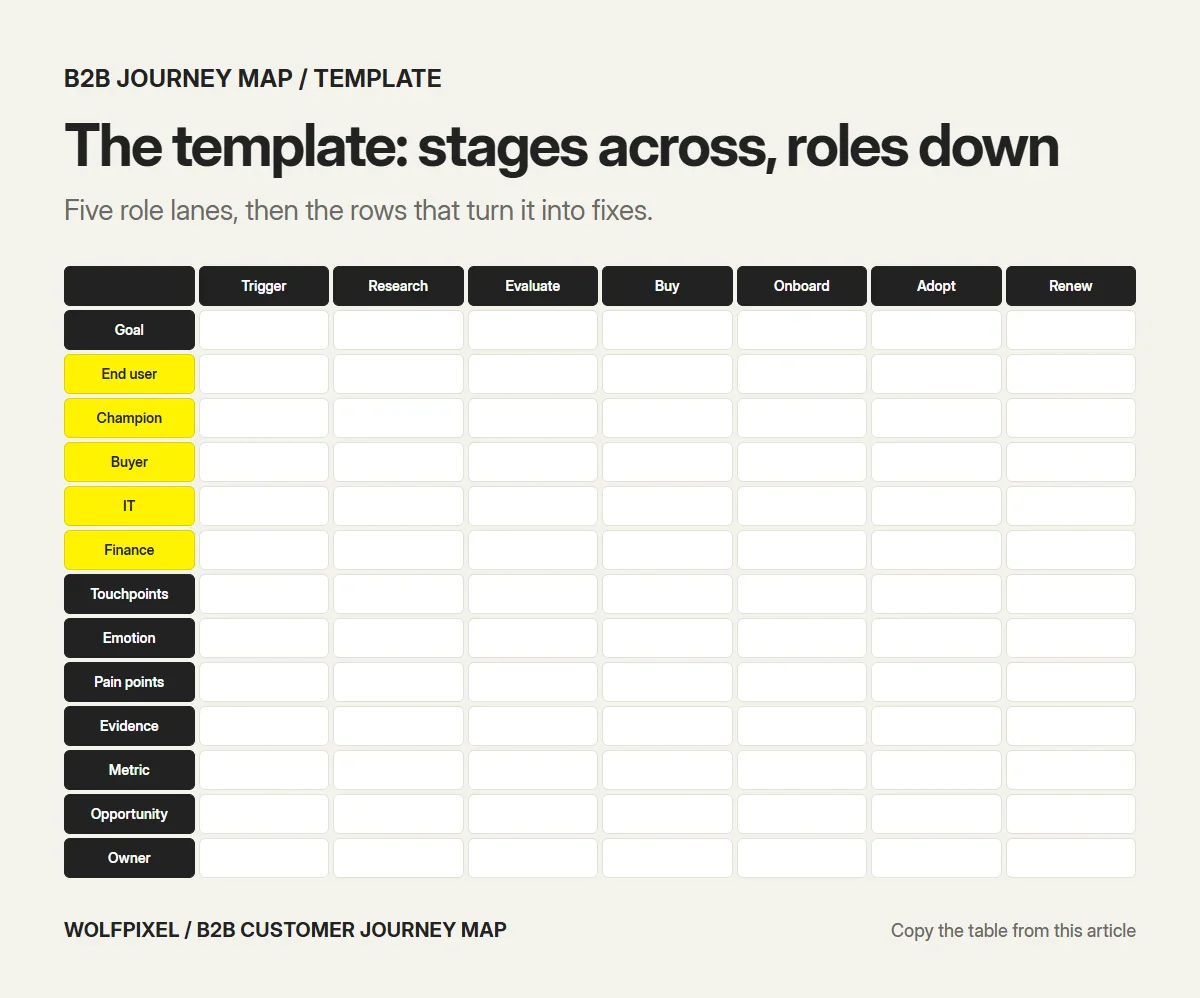
For the metric row, choose one number per stage that shows whether it works: research-to-demo conversion, trial-to-paid rate, days spent in security review, time to first value, weekly active users per account and net revenue retention are common choices.
Turn the map into a ranked fix list
A finished map often surfaces 30 or more problems. Ranking them is what makes the map useful. A simple scoring method:
| Factor | Question | Score |
|---|---|---|
| Impact | How much does this affect deals or renewals? | 1 to 3 |
| Frequency | How many accounts hit it? | 1 to 3 |
| Confidence | Is it observed or assumed? | 1 to 3 |
| Effort | How hard is it to fix? | 1 (hard) to 3 (easy) |
Multiply the four scores and start with the highest. If you want an outside team to score your product touchpoints against real data, that is what a UX audit does. Give each item an owner and the metric that should move. If a problem’s cause sits inside your organization, such as a slow security review, that is when a service blueprint earns its place.
Common B2B journey mapping mistakes
- Mapping one persona. It hides the handoffs where B2B deals stall.
- Stopping at the sale. For SaaS, the post-sale journey decides renewal.
- Building it from opinion. A workshop map without customer evidence mostly reflects what the team already believes.
- Leaving out the product. Trials, onboarding and admin setup are touchpoints too.
- No owners or metrics. Without them, the map becomes a poster.
Sources and method
We reviewed every source below in November 2026.
- Nielsen Norman Group: Journey mapping 101, for the definition, the components of a journey map and the B2B note on “customer.”
- Nielsen Norman Group: Service blueprints, definition, for journey maps vs service blueprints.
- Gartner press release, May 7, 2025, for buying group size and unhealthy conflict.
- Gartner press release, March 9, 2026, for rep-free buying and AI use in purchases.
Our own framework
- The seven-stage SaaS model, the role lanes, the template and the scoring method, based on how we map B2B products.
B2B Customer Journey Map FAQs
What is a B2B customer journey map?
A B2B customer journey map is a visual of the steps, touchpoints, thoughts and pain points a business customer goes through with your company, from recognizing a problem to buying, adopting and renewing. Because several people take part in a B2B purchase, a good B2B map shows each role in its own lane.
What is the B2B customer journey?
It is every stage a buying group goes through with a vendor, from spotting a problem through research, evaluation, purchase, onboarding, adoption and renewal. It involves several stakeholders and a mix of self-serve research and conversations with sales.
What are the 5 stages of a customer journey?
The common five are awareness, consideration, decision, retention and advocacy. For B2B SaaS, it helps to split the post-sale part into onboarding, adoption and expansion, and renewal, because that is where recurring revenue is won or lost.
What are the 7 steps to map the customer journey?
Set the goal and scope, choose the roles to map, gather evidence from interviews, CRM and product data, define the stages, plot each role’s actions, thoughts and touchpoints, find the pain points, then turn them into owned, ranked fixes.
How do I create a customer journey map?
Pick one scenario and the roles involved, research real customers rather than relying on internal opinion, lay out the stages as columns and the roles and touchpoints as rows, mark what is observed and what is assumed, and finish with a ranked list of fixes. Review it with customers and update it as the product changes.
What is the difference between a B2B and a B2C customer journey map?
A B2C map usually follows one person making a fairly quick decision. A B2B map follows a group of people with different goals, a longer cycle, a security and procurement review and, for software, a post-sale journey of onboarding, adoption and renewal that decides most of the revenue.
What is the difference between a journey map and a service blueprint?
A journey map shows the experience from the customer’s side. A service blueprint shows the organization’s side behind it, including frontstage and backstage actions and the processes that support each step. Nielsen Norman Group describes the blueprint as a part two to the journey map.
Who should be on a B2B customer journey map?
Map the roles that can move or stop the deal and the account. That usually means the end user, the champion, the economic buyer, IT and security, and procurement or finance. Larger deals may add legal, an executive sponsor or an admin who manages the product.
How often should you update a customer journey map?
Review it whenever something major changes, such as a new pricing model, a new segment or a redesigned onboarding, and at least once or twice a year. A map nobody updates turns from a tool into a poster.
Want a journey map built from real customer evidence?
Tell us your product and where deals or accounts stall. A senior designer replies within 4 business hours with a research plan and a fixed quote.

Was this article helpful?

Written by
Maniruzzaman Jubayer
Co-founder & COO | Product Design Specialist at Wolfpixel
Maniruzzaman Jubayer is Wolfpixel’s Co-founder & COO and a product design specialist with 7 years of experience. He personally oversees website, app, dashboard and digital product design at Wolfpixel, where journey mapping is part of UX research for B2B and SaaS products. This guide shows how to build a B2B customer journey map from evidence, role by role. Wolfpixel offers the UX research services discussed in the article.
View all articles