




 19 min read
 Published
A UX survey is a set of written questions that asks users about their experience with a product: how easy a task felt, how satisfied they are, which problem matters most. Nielsen Norman Group calls surveys a quantitative, attitudinal research method. That one phrase explains both their strength and their limit. Surveys tell you what many people think. They don’t show you what people do.
I’m Maniruzzaman Jubayer, Co-founder & COO and Product Design Specialist at Wolfpixel, with 7 years of experience. Most UX survey guides online are written by survey tool companies, so they rarely tell you when not to run one. This guide does, then gives you 40 questions, the exact wording of the standard usability scales and a way to analyze the answers.
The short answer: use a UX survey when you need to measure an attitude across many users, such as satisfaction, perceived ease or which problem matters most. Keep it short, ask about past behavior rather than future intentions, use a standardized scale where one exists, and decide before you launch which decision the results will inform.
Key takeaways:
- Surveys measure what people say, not what they do. For “why do users drop off?”, watch them in a usability test instead.
- Use a standard scale when one fits: SEQ after a task, SUS or UMUX-Lite for the whole product. You get benchmarks for free.
- Short wins. In SurveyMonkey’s data, completion fell from 89% at 10 questions to 79% at 40.
- About 381 responses give a margin of error of roughly ±5 points. About 93 give ±10.
- Analysis starts before launch. If you can’t say what each answer would change, cut the question.
How we wrote this: we reviewed the pages ranking for this topic in November 2026, including Maze, UXPin, Jotform, UXArmy, UserTesting and Pollfish, and read the Nielsen Norman Group and MeasuringU research behind them. Figures are linked to the original publisher. The 40 questions, the bias examples and the analysis steps are our own recommendations, and we label them that way. The full list is in Sources and method.
What is a UX survey?
A UX survey asks users to answer the same questions in writing, usually online, so you can compare and count the answers. It can be one question that pops up after a task or a twenty-question study sent by email.
Three terms get mixed up:
- Survey: the whole study, including who you ask, when and how you analyze the results.
- Questionnaire: the list of questions itself. The System Usability Scale is a questionnaire you can put inside a survey.
- Poll: a single quick question, usually with results shown to everyone.
What makes a survey a UX survey is the subject. It asks about using the product: finding things, completing tasks, understanding screens and feeling confident, rather than about brand awareness or pricing.
When to use a UX survey (and when not to)
Nielsen Norman Group’s rule is simple. Surveys are for questions that are quantitative in nature and deal with attitudinal responses. Its example is cart abandonment. Asking people why they abandoned a cart is a survey about a behavior, and behavior can be observed, so a usability test or analytics will give you a better answer.
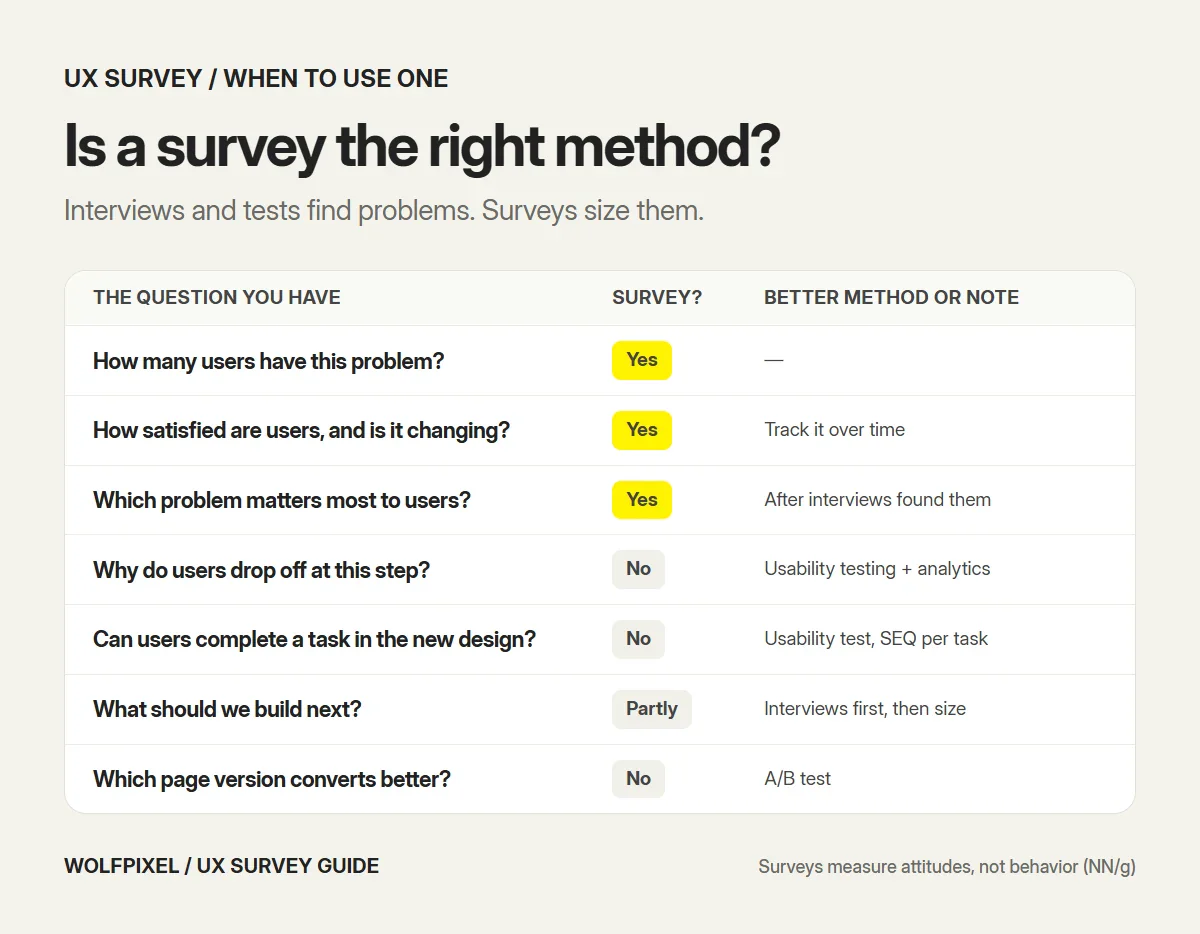
| The question you have | Is a survey right? | Better method if not |
|---|---|---|
| How many of our users have this problem? | Yes | Survey fits |
| How satisfied are users, and is it changing? | Yes, tracked over time | Survey fits |
| Which of these problems matters most to users? | Yes, after interviews found the problems | Survey fits |
| Why do users drop off at this step? | No, that is a behavior | Usability testing and analytics |
| Can users complete a task in the new design? | No | Usability testing, with an SEQ after each task |
| What should we build next? | Not on its own | Interviews first, then a survey to size the answers |
| Which version of a page converts better? | No | A/B test |
The pattern we use: interviews and tests find the problems, surveys size them. Five interviews might reveal that admins struggle to invite teammates. A survey then tells you whether that affects 5% of accounts or 60%. For the other methods and when each one fits, see our guide to the types of UX research.
Surveys are also weak at predicting the future. People are poor judges of what they will do, so “Would you use this feature?” mostly measures politeness. Nielsen Norman Group’s survey best practices recommend asking about past behavior rather than future intentions.
Types of UX surveys
Most UX surveys fall into one of six types. The type decides where the survey appears, how long it can be and which questions belong in it.
| Type | When it runs | Typical length | What it measures |
|---|---|---|---|
| Post-task survey | Right after a task in a test or in the product | 1 to 2 questions | Perceived ease of that task (SEQ) |
| Product usability survey | Periodically, by email or in-app | 2 to 10 questions | Overall usability (SUS or UMUX-Lite) |
| Onboarding survey | After signup or after the first week | 3 to 5 questions | Goals, setup friction, time to value |
| Satisfaction and loyalty survey | Quarterly or after key moments | 2 to 3 questions | CSAT, NPS, effort |
| Product-market fit survey | Once you have active users | 3 to 4 questions | How disappointed users would be without the product |
| Churn or cancellation survey | During cancellation | 1 to 3 questions | Reasons for leaving and what would have kept them |
For the onboarding moment, our guide to SaaS user onboarding covers which steps to measure. For cancellations, our guide to reducing SaaS churn covers what to do with the reasons people give.
40 UX survey questions by goal
The questions below are our recommended starting set, grouped by what you need to learn. Don’t send all 40. Pick the group that matches your decision, take three to ten questions from it and replace [product], [task] and [feature] with your own words. Standard questions are marked, because their wording should not be changed.
Screener and context
Use these to filter respondents and to segment the results later.
- Which of these best describes your role? (single choice, with “Other”)
- How often do you use [product]? (daily, weekly, monthly, less often, this is my first time)
- What did you use for [job] before [product], if anything? (list of options, with “Nothing” and “Other”)
- What is the main thing you use [product] for? (single choice from your top jobs, with “Other”)
- How many people on your team use [product]? (ranges, useful for B2B products)
Onboarding and first use
- What were you hoping to get done when you signed up? (open)
- How easy or difficult was it to get set up? (7-point scale, very difficult to very easy)
- Was anything missing or unclear during setup? (yes or no, with an open follow-up for “yes”)
- How long did it take before [product] was useful to you? (same day, within a week, within a month, not yet)
- Did you need help from anyone to get started? (no, a colleague, your support team, docs or videos)
Task ease and usability
- How easy or difficult was it to complete this task? (SEQ, 7-point, very difficult to very easy. Standard wording)
- Were you able to complete what you came to do today? (yes, partly, no)
- What, if anything, got in your way? (open)
- [Product]’s capabilities meet my requirements. (UMUX-Lite item 1, 7-point agreement. Standard wording)
- [Product] is easy to use. (UMUX-Lite item 2, 7-point agreement. Standard wording)
- How confident are you that you completed [task] correctly? (7-point, not at all confident to very confident)
Navigation and findability
- How easy or difficult was it to find [feature or information]? (7-point scale)
- Where did you expect to find [feature]? (open)
- In the last month, how have you looked for help with [product]? (search, help center, support chat, a colleague, I haven’t)
- Is there anything you do often that takes too many steps? (open)
Feature value and priorities
- Which of these features have you used in the last 30 days? (multiple choice, with “None of these”)
- How valuable is [feature] to your work? (5-point, not at all valuable to extremely valuable, with “I don’t use it”)
- If you could change one thing about [product], what would it be? (open)
- Which of these problems costs you the most time today? (single choice from problems found in interviews)
- Rank these improvements by how useful they would be to you. (ranking, five items at most)
- What other tools do you use alongside [product] to get [job] done? (multiple choice, with “Other”)
Satisfaction and loyalty
- Overall, how satisfied are you with [product]? (5-point, very dissatisfied to very satisfied)
- How likely are you to recommend [product] to a friend or colleague? (NPS, 0 to 10. Standard wording)
- What is the main reason for your score? (open, always pair it with question 28)
- [Product] made it easy for me to [complete task]. (7-point agreement, adapted from the Customer Effort Score)
- Compared with other tools you have tried, how well does [product] meet your needs? (much worse to much better, with “I haven’t tried others”)
Product-market fit
- How would you feel if you could no longer use [product]? (very disappointed, somewhat disappointed, not disappointed. Sean Ellis’s wording)
- What type of person do you think would benefit most from [product]? (open)
- What is the main benefit you get from [product]? (open)
The benchmark for question 32 comes from Sean Ellis: when at least 40% of active users answer “very disappointed,” the product is likely to have found product-market fit. Superhuman’s founder has described starting at 22% and using the survey to steer the roadmap. Questions 33 and 34 are the follow-ups we pair with it. If you are still deciding what the first version should include, our guide to what MVP means in software development covers that step.
Churn and cancellation
- What is the main reason you’re cancelling? (single choice from known reasons, with “Other”)
- What would have needed to change for you to stay? (open)
- What will you use instead? (list of alternatives, with “Nothing” and “Other”)
- How easy or difficult was it to cancel? (7-point scale)
Open questions and follow-up
- Is there anything you expected [product] to do that it doesn’t? (open)
- May we contact you to talk about your answers? (yes with email, or no)
Question 40 is the bridge back to qualitative research. The people who say yes are your next interview participants, and they already told you what they care about.
Standardized UX survey questionnaires: SUS, SEQ and UMUX-Lite
When a standard questionnaire fits your question, use it instead of writing your own. The wording has been tested, and published averages let you tell whether a score is good.
System Usability Scale (SUS)
The SUS was released by John Brooke in 1986 and is still one of the most common usability questionnaires. Respondents rate ten statements from 1 (strongly disagree) to 5 (strongly agree):
- I think that I would like to use this system frequently.
- I found the system unnecessarily complex.
- I thought the system was easy to use.
- I think that I would need the support of a technical person to be able to use this system.
- I found the various functions in this system were well integrated.
- I thought there was too much inconsistency in this system.
- I would imagine that most people would learn to use this system very quickly.
- I found the system very cumbersome to use.
- I felt very confident using the system.
- I needed to learn a lot of things before I could get going with this system.
How to score it: for the odd-numbered items, subtract 1 from the answer. For the even-numbered items, subtract the answer from 5. Add the ten results and multiply by 2.5. That gives a score from 0 to 100. It is not a percentage, so 70 doesn’t mean 70% usable.
What is a good score: the average SUS score across 500 studies analyzed by MeasuringU is 68. Above 68 is above average.
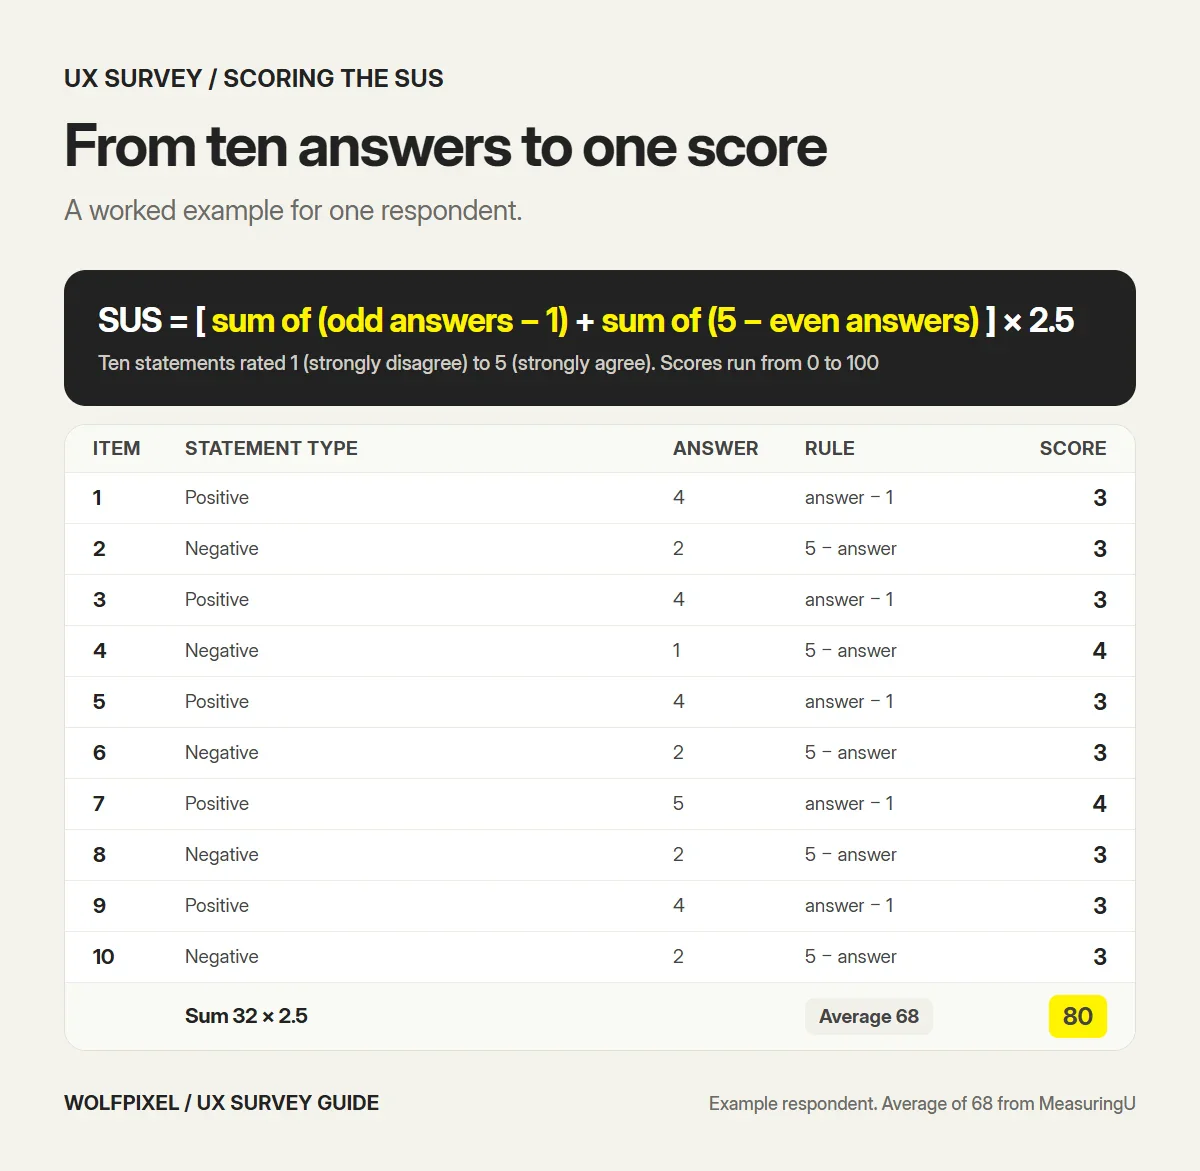
Here is a worked example for one respondent who answered 4, 2, 4, 1, 4, 2, 5, 2, 4, 2:
| Items | Answers | Rule | Item scores | Subtotal |
|---|---|---|---|---|
| Odd (1, 3, 5, 7, 9) | 4, 4, 4, 5, 4 | Answer minus 1 | 3, 3, 3, 4, 3 | 16 |
| Even (2, 4, 6, 8, 10) | 2, 1, 2, 2, 2 | 5 minus answer | 3, 4, 3, 3, 3 | 16 |
| Total | All ten | Sum × 2.5 | 32 × 2.5 | 80 |
The product’s score is the average of all respondents’ scores.
Single Ease Question (SEQ)
The SEQ is one question asked right after a task: “How easy or difficult was it to complete this task?” on a 7-point scale from very difficult to very easy. MeasuringU reports that the average has settled at about 5.5. A task that scores well below that is worth watching in a recording.
We add the SEQ after tasks in usability tests, because it puts a number next to what you watched without slowing the session down.
UMUX-Lite
When ten SUS items are too many, the UMUX-Lite uses two:
- [This system’s] capabilities meet my requirements.
- [This system] is easy to use.
Both are rated on a 7-point agreement scale. It fits well inside an in-product survey where every question costs responses.
NPS and CES: useful, but not usability measures
The Net Promoter Score asks how likely someone is to recommend the product, from 0 to 10. Scores of 9 and 10 are promoters, 0 to 6 are detractors, and NPS is the percentage of promoters minus the percentage of detractors. Nielsen Norman Group warns that customer loyalty is not identical to usability, that NPS is rarely useful with small samples and that it is often gamed. Track it for loyalty, not as your measure of the experience.
The Customer Effort Score asks how easy the company made it to get something done. The CES 2.0 statement, as reported by Great Brook, is “The company made it easy for me to handle my issue,” rated on a 7-point agreement scale. Question 30 above adapts it to a product task.
How to write UX survey questions without bias
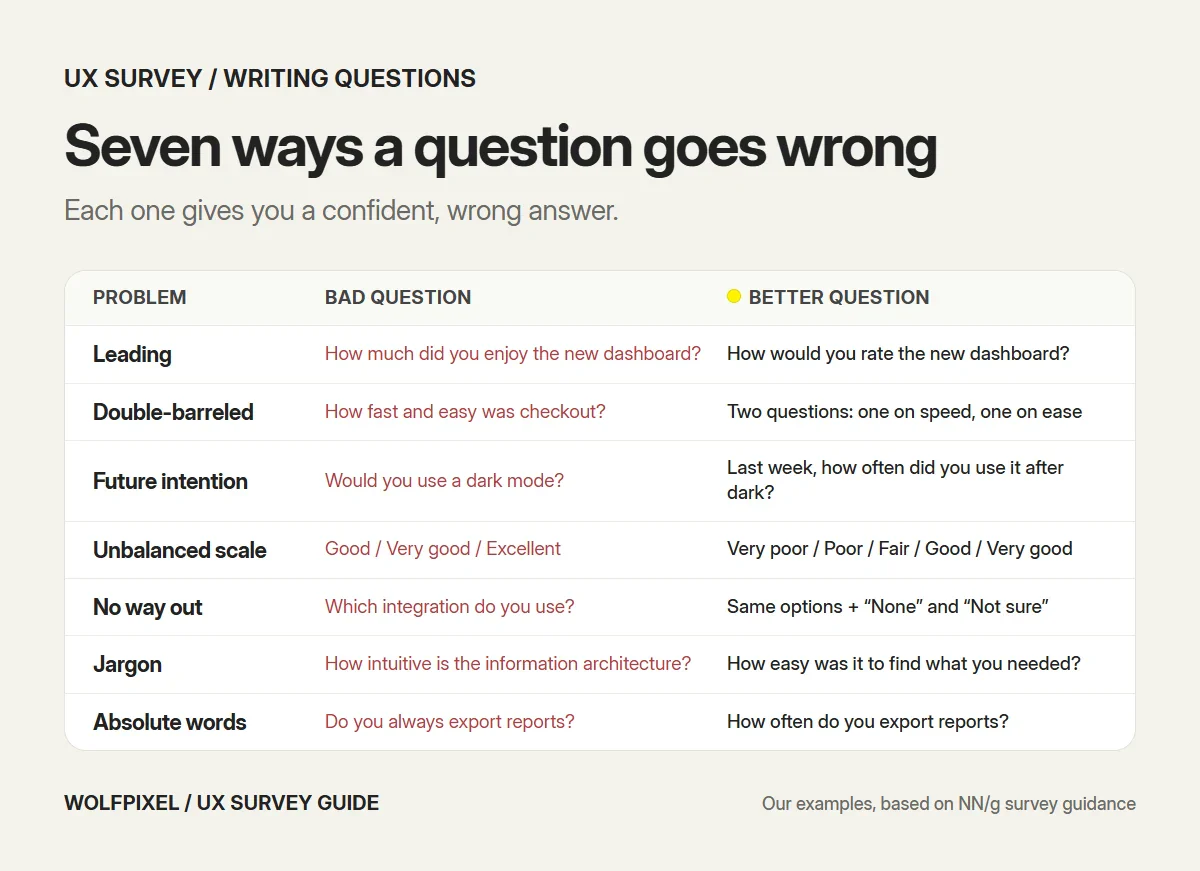
A biased question gives you a confident, wrong answer. These are the mistakes we see most often, with a better version of each.
| Problem | Bad question | Better question |
|---|---|---|
| Leading | How much did you enjoy the new dashboard? | How would you rate the new dashboard? (very poor to very good) |
| Double-barreled | How fast and easy was checkout? | Ask two questions, one about speed and one about ease. |
| Future intention | Would you use a dark mode? | In the last week, how often did you use [product] after dark? |
| Unbalanced scale | Good, very good, excellent | Very poor, poor, fair, good, very good |
| No way out | Which integration do you use? | Same options, plus “None” and “Not sure.” |
| Jargon | How intuitive is the information architecture? | How easy was it to find what you needed? |
| Absolute words | Do you always export reports? | How often do you export reports? |
Nielsen Norman Group defines a double-barreled question as one that asks respondents to answer two things at once, and notes that a balanced scale removes a source of bias. The same article recommends making most questions optional and adding opt-out answers, so people don’t invent an answer to get past a question.
Three more rules about the scale itself, from MeasuringU’s review of the rating scale research:
- A neutral midpoint is fine for UX questions you will average and compare.
- Use more than three points so you capture how strongly people feel. Five or seven is typical.
- Be consistent. Keep the same direction and number of points across the survey, so “high” always means good.
Finally, pilot the survey. Ask two or three colleagues outside the project, or two real users, to answer while thinking out loud. You will find at least one question they read differently from how you meant it.
How long should a UX survey be?
Shorter than you want it to be. SurveyMonkey analyzed more than 26,000 surveys and found that 10-question surveys had an average completion rate of 89%, compared with 79% for 40-question surveys. The median survey had 12 questions.
Nielsen Norman Group’s advice is blunter: 20 questions are too many unless your participants are highly motivated, and people are much more likely to answer a one-question survey.
Our working limits:
- In-product survey: one to three questions. It interrupts a task, so it has to be fast.
- Email survey to active users: up to about ten questions, five minutes at most.
- Research panel with an incentive: longer is possible, but every question still has to inform a decision.
Lost completions aren’t the only cost. People who drop out halfway are rarely random, so a long survey also skews who you hear from.
How many responses does a UX survey need?
It depends on how precise the answer has to be. MeasuringU’s table for 95% confidence is a practical guide:
| Responses | Margin of error (95% confidence) |
|---|---|
| About 93 | ±10 percentage points |
| About 381 | ±5 percentage points |
| About 1,064 | ±3 percentage points |
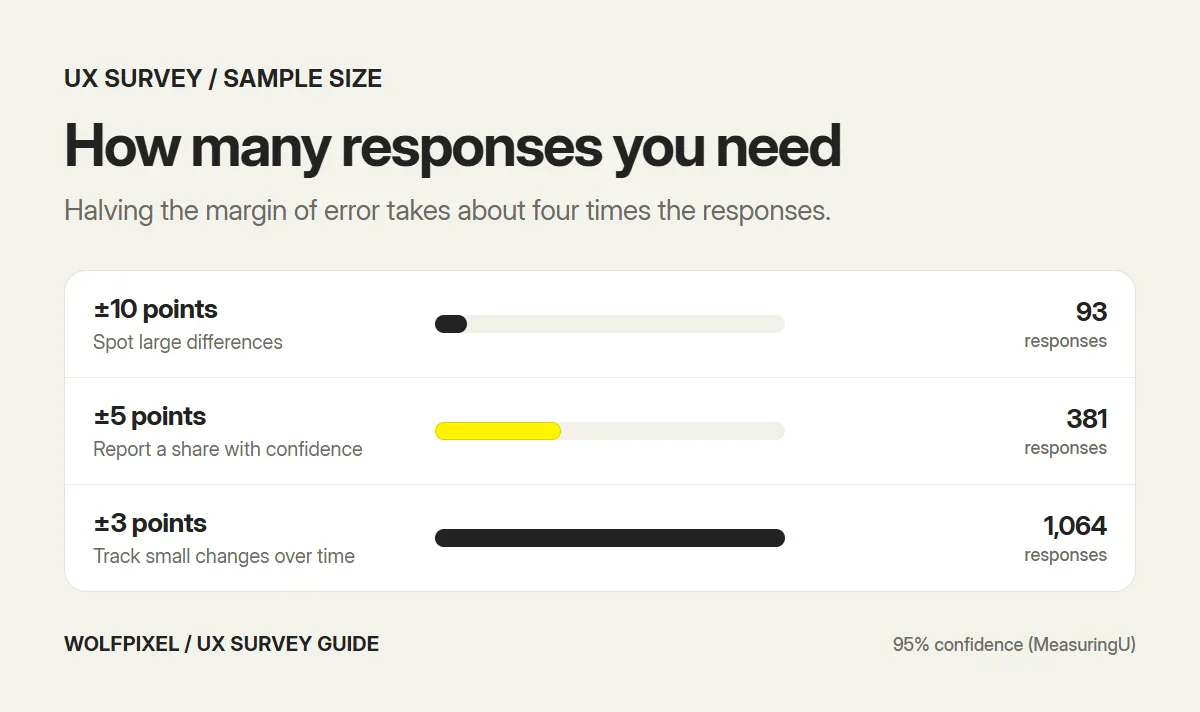
The key pattern: to cut the margin of error in half, you need about four times the responses. SurveyMonkey’s sample size calculator gives a similar 384 for a large population at 95% confidence and a 5% margin.
What that means in practice:
- Spotting a large difference between two groups or options: about 100 responses can be enough when the gap is wide.
- Reporting a share to stakeholders, for example the percentage of admins who struggle with invites: aim for 300 to 400 responses, so the number holds up.
- Open-ended or qualitative surveys: the count matters less than the spread of people. Nielsen Norman Group notes that these results are rarely representative of the whole audience, so treat them like interviews at scale, not like statistics.
Who answers matters as much as how many. If only your happiest users respond, 1,000 answers will still mislead you. Send the survey to a defined group, such as everyone who completed onboarding last month, and compare the respondents with that group by plan, role and tenure.
How to run a UX survey in 7 steps
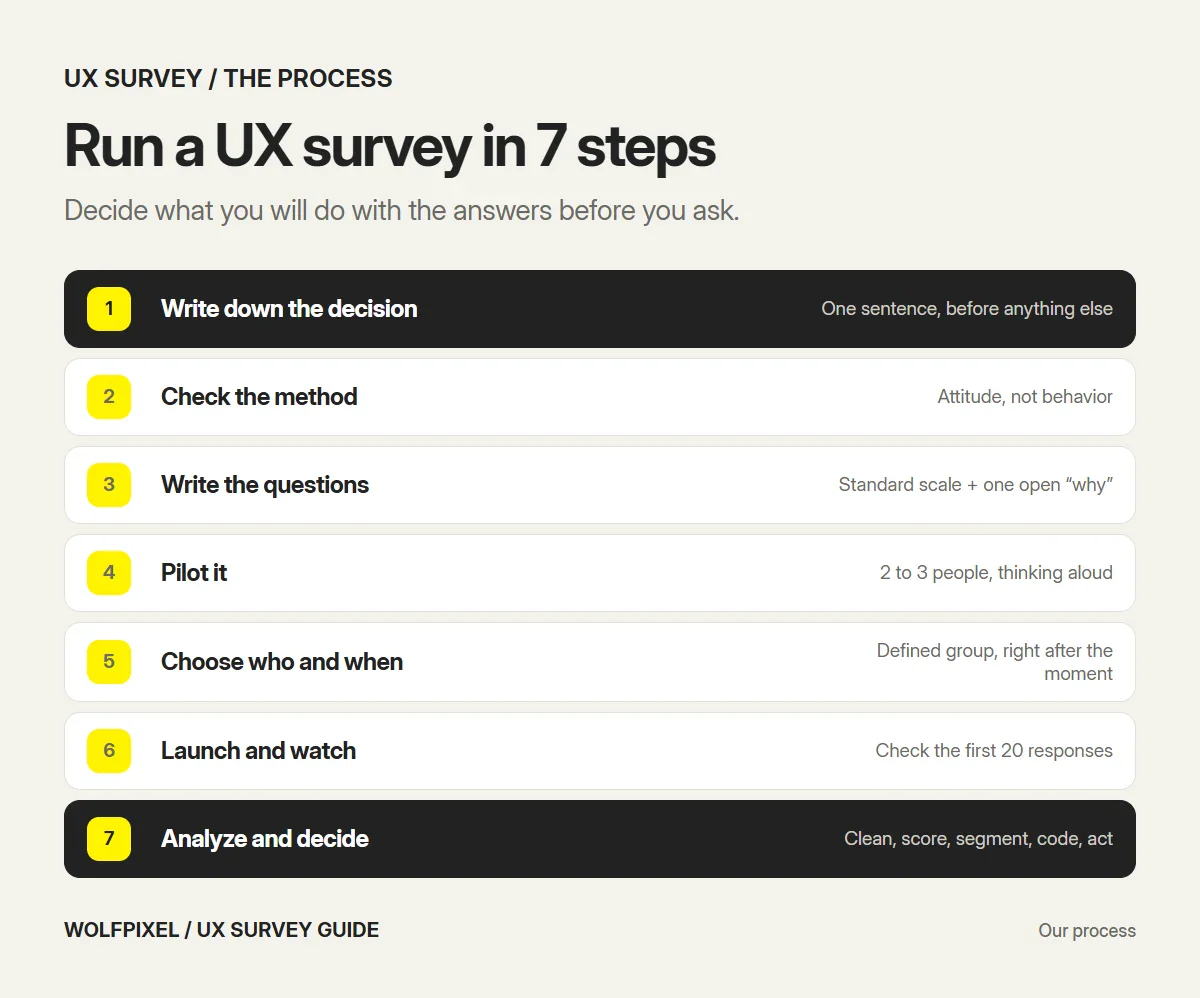
- Write down the decision. One sentence: “We will use the results to decide whether to redesign team invites this quarter.” If you can’t write it, you aren’t ready to survey.
- Check that a survey is the right method. Use the table above. If the question is about behavior, run a test or check analytics first.
- Write the questions. Start with a standard scale where one fits, add the few questions specific to your decision and finish with one open “why.”
- Pilot it. Two or three people answer while thinking out loud. Fix every question they misread.
- Choose who and when. Define the group, trigger the survey right after the relevant experience and set the target number of responses from the table above.
- Launch and watch the first 20 responses. Check that answers make sense and that nobody is stuck on one question, then let it run.
- Analyze and decide. Use the steps in the next section, then make the decision you wrote down in step 1.
How to analyze UX survey results
This is the part most guides skip. The method below is the one we follow.
1. Clean the data. Remove incomplete responses you can’t use, test entries and duplicates. Flag “speeders,” people who finished much faster than the median, and “straight-liners,” people who gave the same answer to every rating. The SUS helps here, because its items alternate between positive and negative. Anyone who agrees with all ten wasn’t reading.
2. Score the standard questions. Calculate SUS, SEQ or UMUX-Lite scores as described above, then compare them with the published averages (68 for SUS, about 5.5 for SEQ) and with your own earlier results.
3. Report ranges, not single numbers. “42% of admins find invites difficult, ±5 points” is honest. “42%” on its own suggests a precision you don’t have. If two numbers are within each other’s margin of error, don’t call one higher.
4. Segment. Split the results by the screener questions: role, plan, tenure, how often people use the product. An overall score can hide a group with a much worse experience, and that group is often the one you need to design for.
5. Code the open answers. Read a sample of 30 to 50 answers and write a short list of codes, such as “can’t find export” or “slow on mobile.” Tag every answer with one or more codes, count each code and pick two or three quotes that explain it best. Add new codes as they appear, then re-check the earlier answers.
6. Check what people said against what they did. If the survey says export is hard to find, look at the analytics and a few session recordings. When the numbers and the stories agree, you have a finding. When they don’t, you have a new question for an interview or a usability test.
7. Tie every finding to a decision. For each finding, write the evidence, the decision it informs and the next step. A finding that changes nothing doesn’t belong in the report.
| Finding | Evidence | Decision | Next step |
|---|---|---|---|
| Example: admins struggle to invite teammates | Invite SEQ 4.1 vs 5.6 for other tasks, 38 open answers coded “invites” | Redesign invites this quarter | Prototype two invite flows and test them with five admins |
The example row is an illustration of the format, not a client result. If you want the redesign step itself, our guides to user flow examples and software prototypes cover what comes next.
UX survey tools
Almost any survey tool can run a good UX survey. Choose by where your users are, not by the feature list:
- General survey tools, such as Google Forms, Microsoft Forms, SurveyMonkey, Typeform and Jotform, for email surveys and research panels.
- In-product survey tools, such as Hotjar, Sprig and Pendo, for questions triggered by what a user just did.
- Research platforms, such as Maze and UserTesting, when the survey sits next to a usability test or prototype test.
Whatever you pick, check that it lets you trigger by event, export raw responses, randomize answer order where it makes sense and keep the same scale across surveys.
How we use surveys in UX research at Wolfpixel
In our UX research projects, surveys play one specific role: they size what interviews found, so the team knows whether a problem affects five users or five thousand. The order is usually:
- Interviews with users, buyers and churned customers to find the problems and the words people use for them.
- A focused survey built from those problems and that language, sent to a defined group of users.
- Usability testing of the redesigned flow, with an SEQ after each task.
Each finding is tied to the decision it informs and shared at weekly check-ins, so the team can act before the final readout. If your product is already live and you need to know what to fix first, a UX audit may be a faster start than new research. Our guide to the B2B customer journey map shows how survey findings fit into a wider map of the buyer and user experience.
Sources and method
We reviewed every source below in November 2026.
- Nielsen Norman Group: Should you run a survey? (February 23, 2024), for surveys as a quantitative, attitudinal method and the cart abandonment example.
- Nielsen Norman Group: Survey best practices (August 20, 2023), for double-barreled questions, balanced scales, past behavior, opt-out answers and optional questions.
- Nielsen Norman Group: 28 tips for creating great qualitative surveys (September 25, 2016), for survey length and representativeness.
- Nielsen Norman Group: Net Promoter Score and UX (June 21, 2024), for the NPS question, scoring and limits.
- MeasuringU: Measuring usability with the System Usability Scale (February 3, 2011), for the SUS origin, items, scoring and the average of 68.
- MeasuringU: The evolution of the Single Ease Question (August 6, 2024), for the SEQ wording and the average of about 5.5.
- MeasuringU: UMUX-Lite (October 11, 2017), for the two UMUX-Lite items.
- MeasuringU: Rating scales, myth vs evidence (May 20, 2020), for neutral points, number of points and consistency.
- MeasuringU: Tree testing, with a sample size and margin of error table (March 26, 2013), for the 93, 381 and 1,064 table.
- SurveyMonkey: Sample size calculator (August 12, 2026), for the 384 example.
- SurveyMonkey: Half of SurveyMonkey surveys are short (undated), for completion rates by survey length.
- Great Brook: Effortless experience questionnaire design (June 21, 2014), for the CES 2.0 wording.
- First Round Review: How Superhuman built an engine to find product-market fit (November 12, 2018), for Sean Ellis’s question, the 40% benchmark and Superhuman’s starting score of 22%.
Our own recommendations
- The 40 questions (apart from the standard items marked as such), the bias examples, the length limits, the seven-step process and the analysis method, based on how we run research at Wolfpixel.
UX Survey FAQs
What is a UX survey?
A UX survey is a set of written questions that asks users about their experience with a product, such as how easy a task felt, how satisfied they are or which problem matters most to them. Nielsen Norman Group describes surveys as a quantitative, attitudinal research method, which means they are best at measuring what many people think or feel.
What questions should I ask in a UX survey?
Start from the decision the survey has to inform, then ask only the questions that inform it. Most UX surveys combine a few screener questions, one standardized rating such as the SEQ, SUS or UMUX-Lite, two or three questions about the specific problem, and one open question that asks why.
How many questions should a UX survey have?
As few as the decision needs. For in-product surveys, one to three questions is usually right. For a longer survey sent by email, keep it under about ten questions. SurveyMonkey found an average completion rate of 89% for 10-question surveys and 79% for 40-question surveys.
How many responses do I need for a UX survey?
It depends on how precise the result has to be. At 95% confidence, about 93 responses give a margin of error of roughly plus or minus 10 points, about 381 give plus or minus 5 points and about 1,064 give plus or minus 3 points, according to MeasuringU. Halving the margin of error takes about four times the responses.
What is a good SUS score?
The average System Usability Scale score across 500 studies analyzed by MeasuringU is 68. A score above 68 is above average and a score below 68 is below average. Compare the score with your own earlier results too, because the trend over time is often more useful than a single number.
What is the difference between a UX survey and usability testing?
A survey asks people what they think and feel, at scale. A usability test watches a smaller number of people try to complete tasks, so you see what they actually do and where they get stuck. Use testing to find problems and surveys to measure how widespread they are or how satisfied people feel.
When should you send a UX survey?
Send it right after the experience you are asking about, while it is fresh, such as after a task, after onboarding or when someone cancels. For tracking metrics like SUS or NPS, survey at a regular interval, for example every quarter, so you can compare results over time.
Is NPS a good UX metric?
NPS measures willingness to recommend, which is closer to loyalty than to usability. Nielsen Norman Group notes that NPS is rarely useful with small samples and can be gamed. Use it for tracking loyalty over time, and use usability measures such as the SEQ or SUS to judge the experience itself.
How do you analyze open-ended survey responses?
Read a sample of answers first, create a short list of codes for the themes you see, tag every answer with one or more codes, then count how often each code appears. Report the biggest themes with their counts and two or three quotes each, and check them against analytics or recordings before acting.
Need a survey that answers a real product question?
Tell us the decision you are trying to make. A senior designer replies within 4 business hours with the right method, a draft question set and a fixed quote.

Was this article helpful?

Written by
Maniruzzaman Jubayer
Co-founder & COO | Product Design Specialist at Wolfpixel
Maniruzzaman Jubayer is Wolfpixel’s Co-founder & COO and a product design specialist with 7 years of experience. He personally oversees website, app, dashboard and digital product design at Wolfpixel, including the user research that comes before the design. This guide shows when a UX survey is the right method, what to ask and how to read the answers. Wolfpixel offers the UX research services discussed in the article.
View all articles