

 16 min read
 Published

A user flow is a diagram of the steps a user takes inside a product to complete one task, such as signing up, booking an appointment or upgrading a plan. Nielsen Norman Group describes it as the typical or ideal set of steps needed to accomplish a common task with a product. A good one also shows the decisions, errors and exits along the way.
I’m Maniruzzaman Jubayer, Co-founder & COO and Product Design Specialist at Wolfpixel, with 7 years of experience. Most user flow examples online are redrawn from Zoom, Slack or Amazon. Every example below comes from a product we designed, from a delivery app to an AI automation platform, so you can see the flow next to the case study it shaped.
The short answer: a user flow maps one user, one goal and every step between them. The 12 examples below cover ordering, booking, onboarding with identity checks, automation, approvals, payouts and website conversion. Each one lists the steps, the edge paths a complete flow needs and the metric that tells you whether the flow works.
Key takeaways:
- One flow, one goal. If a diagram tries to show signup and upgrade at once, split it.
- Draw the decisions and error paths, not just the happy path. That is where most products lose people.
- Pick the metric before you design. Each flow below ends with the number we would track.
- Use the same symbols every time, so anyone on the team can read any flow.
- Map flows before screens. Fixing a flow on a whiteboard costs minutes. Fixing it in code costs a sprint.
How we wrote this: we reviewed the pages ranking for this topic in November 2026, including Userpilot, Matomo, Figma and Appcues, and the Nielsen Norman Group research they rely on. The 12 flows come from our own case studies, and each one links to its project. The edge paths and metrics are our recommendations for flows of that type, not results reported by those clients. The full list is in Sources and method.
What is a user flow?
A user flow follows one person through one task in your product. It starts at an entry point, such as opening the app or landing on a page, and ends when the goal is reached or the person leaves. In between, it shows each screen or step, the actions the user takes, the decisions the product makes and the paths that branch off when something goes wrong.
User flows are a working tool, not a deliverable to admire. Designers use them to agree on structure before drawing screens, product managers use them to scope features, and developers use them to see every state they need to build. In our own process, flows come before any visual design. On RoomMind AI, for example, low-fidelity wireframes and user flows set the structure of the whole redesign journey before a single screen was styled.
User flow vs task flow vs wireflow vs journey map vs flowchart
These terms overlap, and briefs often mix them up.
| What it shows | Zoom level | Best for | |
|---|---|---|---|
| User flow | Steps, decisions and errors for one user and one goal | One task in the product | Agreeing on structure before design |
| Task flow | A single linear path through one task, often without branches | Narrower than a user flow | Quick alignment on one action |
| Wireflow | Wireframe-style screens connected by flow arrows | A few screens | Showing what changes on each screen |
| Journey map | Stages, touchpoints and emotions across channels and time | The whole relationship | Finding where the overall experience breaks |
| Flowchart | Any process, using standard symbols | Anything | Logic, systems and operations |
Nielsen Norman Group draws the key line between the first and fourth rows: user flows zoom in on specific, discrete interactions, while journeys cover experiences across channels and over time. It describes wireflows as a format that combines wireframe-style page layouts with a simplified flowchart, a practice that emerged from mobile app design. If you need the wider view, our guide to the B2B customer journey map covers it.
How to read the diagrams in this guide
Every diagram below uses the same symbols. They follow standard flowchart conventions, which ANSI set in the 1960s and ISO later published as ISO 5807, with one addition for error paths.
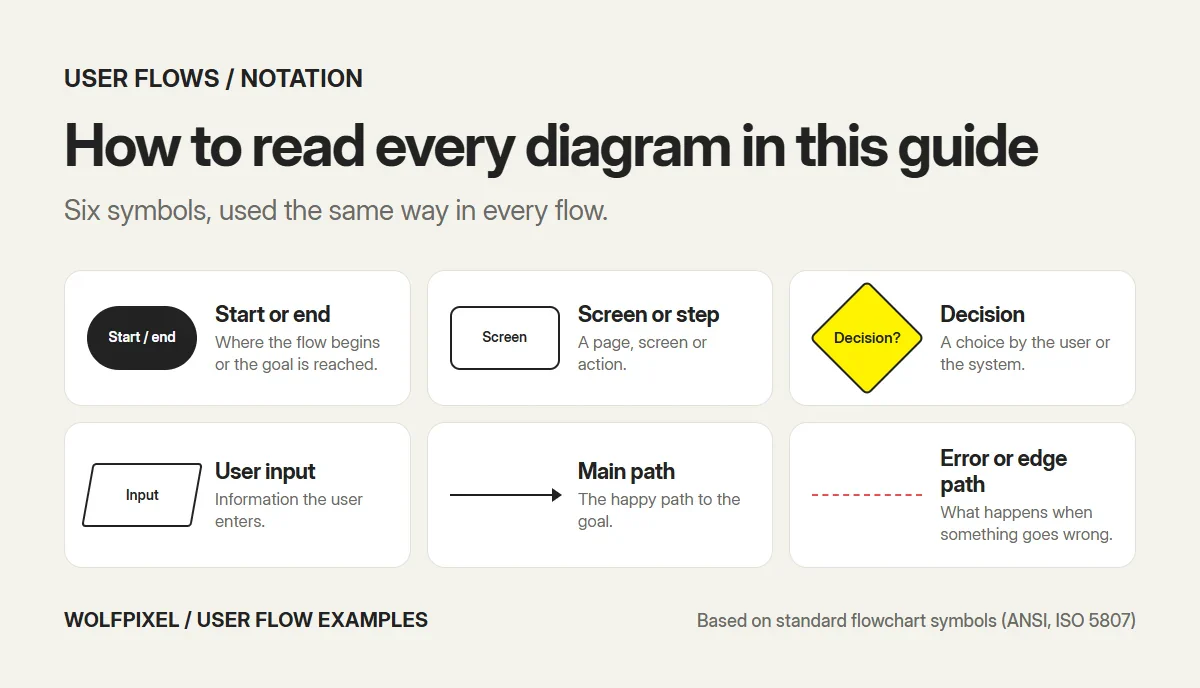
| Symbol | Meaning |
|---|---|
| Rounded shape | Start or end of the flow |
| Rectangle | A screen or step |
| Diamond | A decision, by the user or the system |
| Parallelogram | Information the user enters |
| Solid arrow | The main path |
| Dashed red line | An error or edge path |
12 user flow examples from real products
Each example names the product, the user’s goal, the steps, the edge paths a complete version of the flow needs, and the metric we would track.
1. Ordering a delivery in a logistics app (Shipora)
Product: Shipora, an AI-powered parcel delivery app. Goal: send a parcel without filling in a long form.
- Open the app on a map.
- Enter the pickup location.
- Enter the drop-off destination.
- Choose a service from cards that show the price up front.
- See the route preview with an estimated arrival time.
- Confirm the order and land on the tracking home screen.
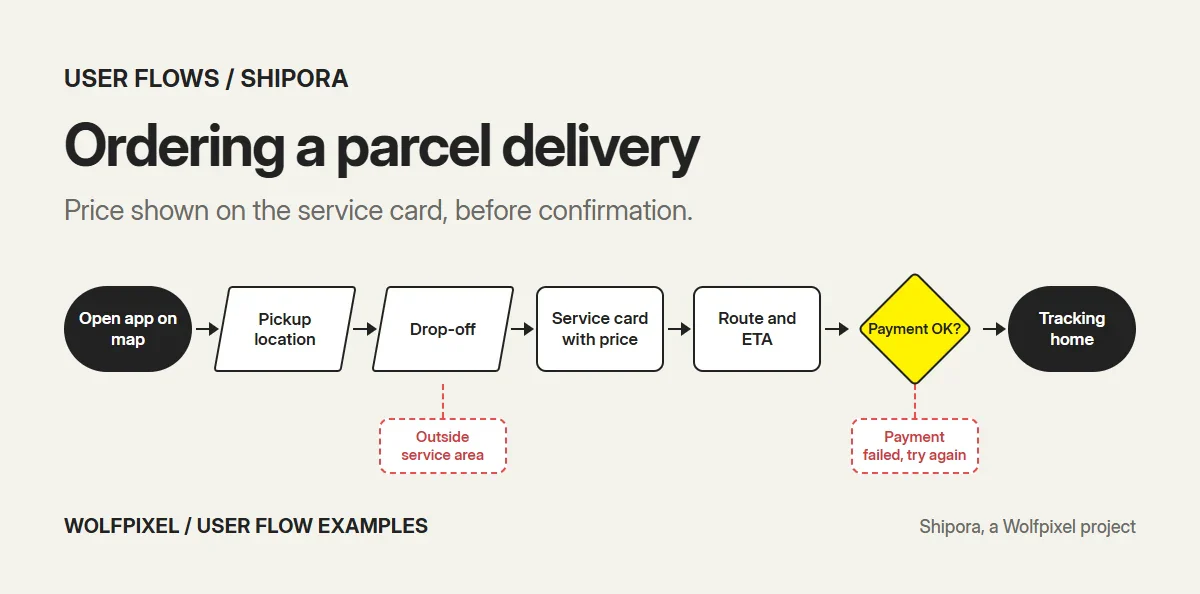
Edge paths to design: an address outside the service area, no service available at that time, a payment that fails at confirmation. Metric to track: order completion rate from opening the map to confirmation.
What makes this flow work is that the price appears on the service card, before confirmation. Showing the cost late is one of the most common reasons people abandon an order at the final step.
2. Checking where a parcel is (Shipora)
Goal: know where the parcel is without contacting support.
- Open the app.
- The home screen leads with the active shipment: ID, origin, destination and estimated arrival.
- Follow progress on a simple line between the points.
- Receive status notifications as the parcel moves.
Edge paths to design: a delayed delivery, a failed delivery attempt, more than one active shipment. Metric to track: “where is my parcel” support contacts per hundred orders.
The design choice here is placement. Tracking is the first thing a returning user sees, not a screen behind a menu.
3. Booking a doctor in a health app (CareUp)
Product: CareUp, an AI-powered healthcare app. Goal: book an appointment with the right specialist.
- Open the home screen, which starts with “Search for a Doctor.”
- Search, or tap a specialty chip such as Cardiologist.
- Compare doctor cards showing specialty, rating, experience, working days and price.
- Pick a day from the day picker on the doctor card.
- Follow the short booking sequence and confirm.
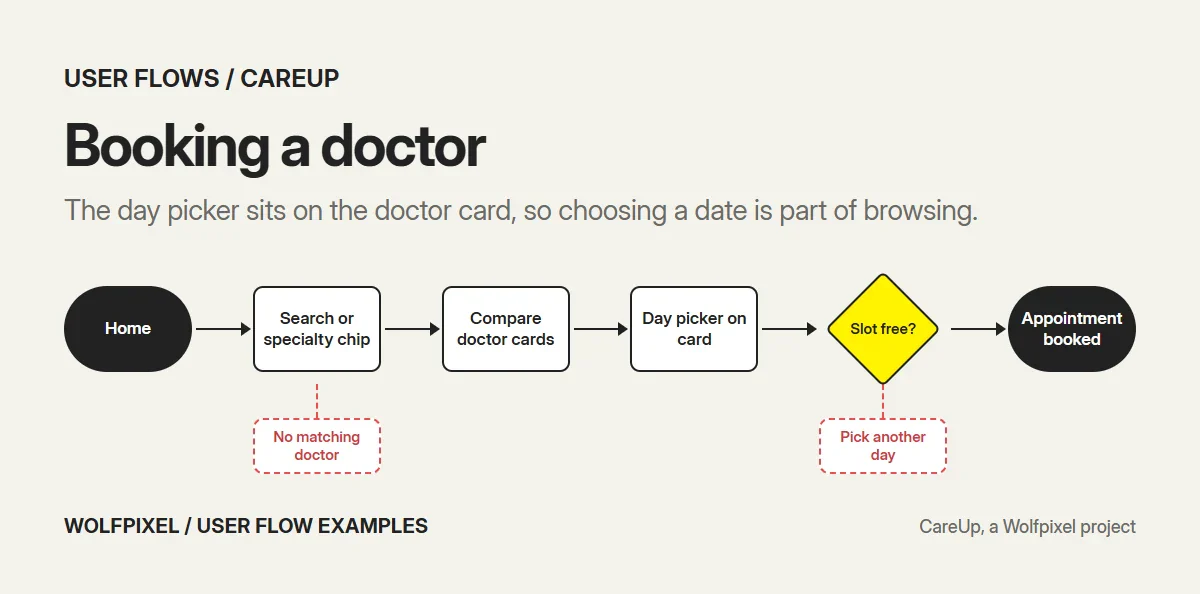
Edge paths to design: no free slot on the chosen day, no doctor matching the filters, the user leaving mid-booking. Metric to track: search-to-booking conversion.
Putting the day picker on the doctor card turns choosing a date into part of browsing, which removes a whole step from the flow.
4. Redesigning a room with AI (RoomMind AI)
Product: RoomMind AI, an AI interior design iOS app. Goal: see a room redesigned in a chosen style.
- Choose the room type: living room, bedroom, kitchen or office.
- Upload a photo from the camera or gallery.
- Watch the AI scan confirm what it captured.
- Choose a style from photos of real rooms.
- Choose a plan, including a free option.
- Get the result and compare before and after.
Edge paths to design: camera permission denied, a photo too dark or blurry to scan, generation taking longer than expected. Metric to track: share of uploads that reach a finished result.
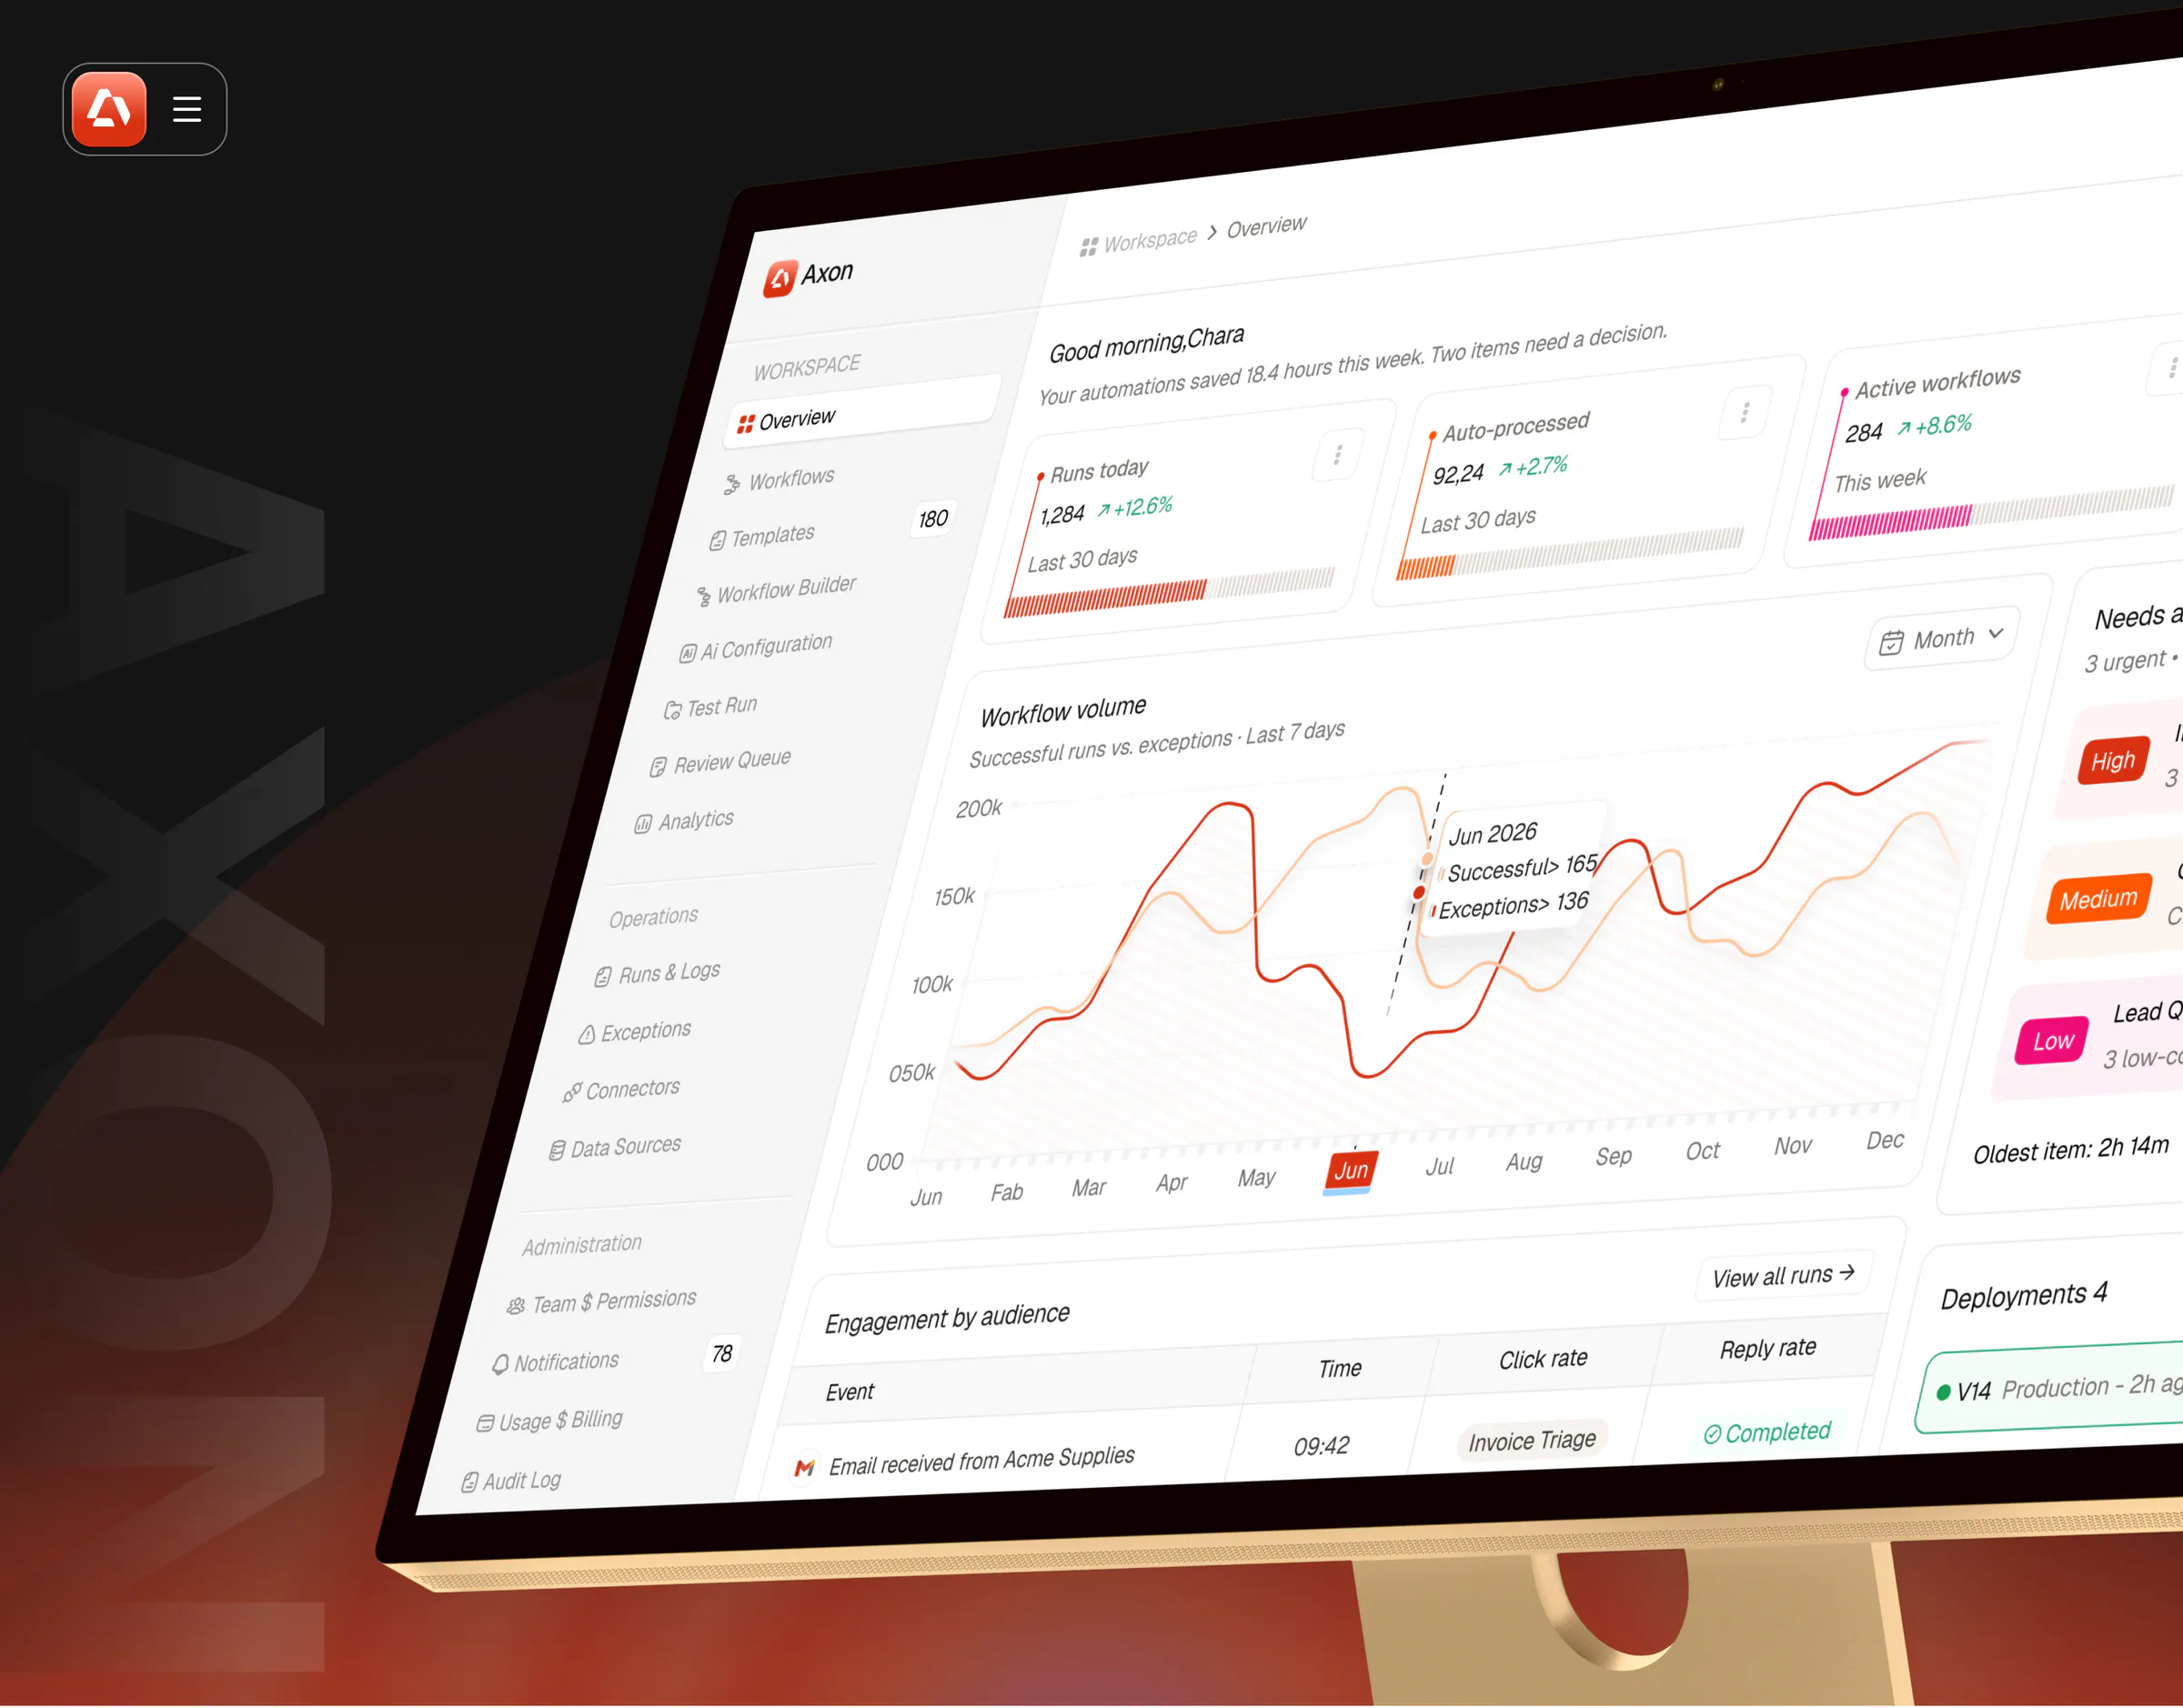
5. Launching an AI automation from a template (Axon)
Product: Axon, an AI workflow automation platform. Goal: put a new automation live without breaking anything.
- Browse the template library, filtered by team.
- Preview the workflow: every step, the apps it needs and where human review happens.
- Customize the steps in the Workflow Builder.
- Run it in a sandbox Test Run.
- If the test passes, go live. If not, return to the builder.
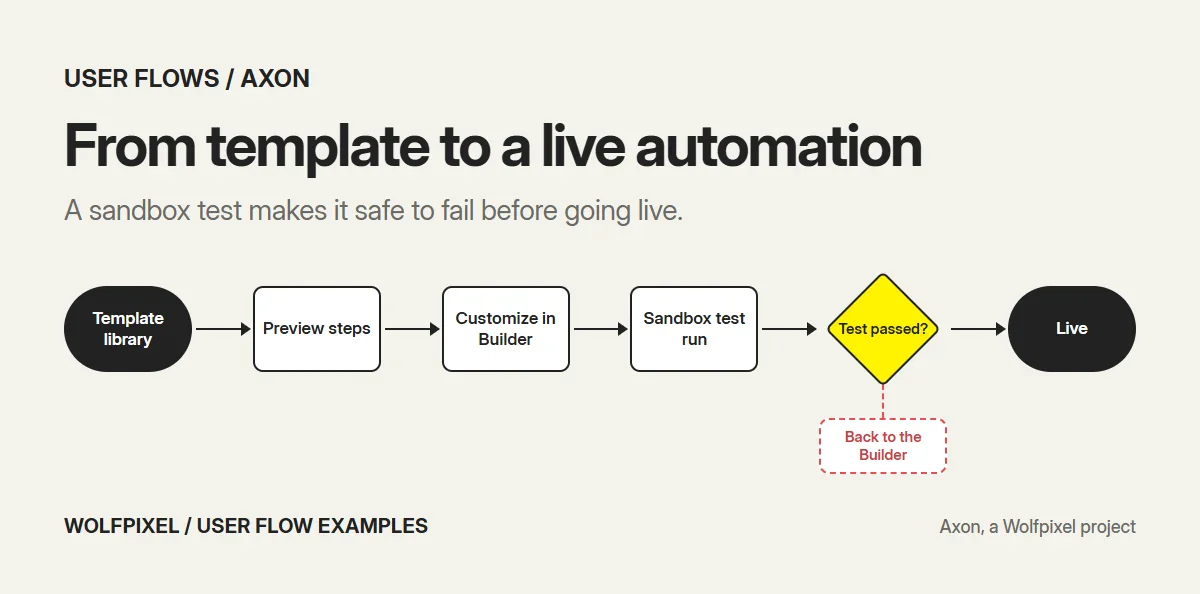
Edge paths to design: a missing app connection, a test run that fails on one step, permissions that stop a user from publishing. Metric to track: share of previewed templates that go live.
The sandbox step is a deliberate loop. In automation, a safe place to fail is what makes people confident enough to launch.
6. Reviewing an AI exception (Axon)
Goal: decide what to do when the AI was unsure.
- Open the Overview, where items needing a decision are ranked high, medium or low.
- Open an item in the Review Queue.
- Compare the source document with the extracted fields and evidence, side by side.
- Approve, or reject with a reason.
- The decision is recorded in the audit log.
Edge paths to design: missing evidence, a reviewer without permission to approve, a queue with no items. Metric to track: time from exception to decision.
7. Launching an affiliate program as a merchant (Earnify)
Product: Earnify, an affiliate growth platform. Goal: get a program live and start approving affiliates.
- Create the program in a short setup flow.
- Launch a campaign.
- Review new affiliate applications on the dashboard.
- Approve or decline each one.
- Track clicks, revenue and payouts on the dashboard.
Edge paths to design: an incomplete program setup, an application missing details, no applications yet. Metric to track: time from signup to the first approved affiliate.
8. Earning a payout as an affiliate (Earnify)
Goal: find an offer and get paid for promoting it.
- Browse offers.
- Apply to an offer.
- Once approved, follow clicks, conversions and revenue.
- See what has been earned and when the payout will arrive.
Edge paths to design: an application declined, a payout on hold, a conversion disputed by the merchant. Metric to track: share of approved affiliates who reach a first payout.
Two flows from one product is common in marketplaces. The merchant and the affiliate want opposite things from the same screens, so each needs its own flow.
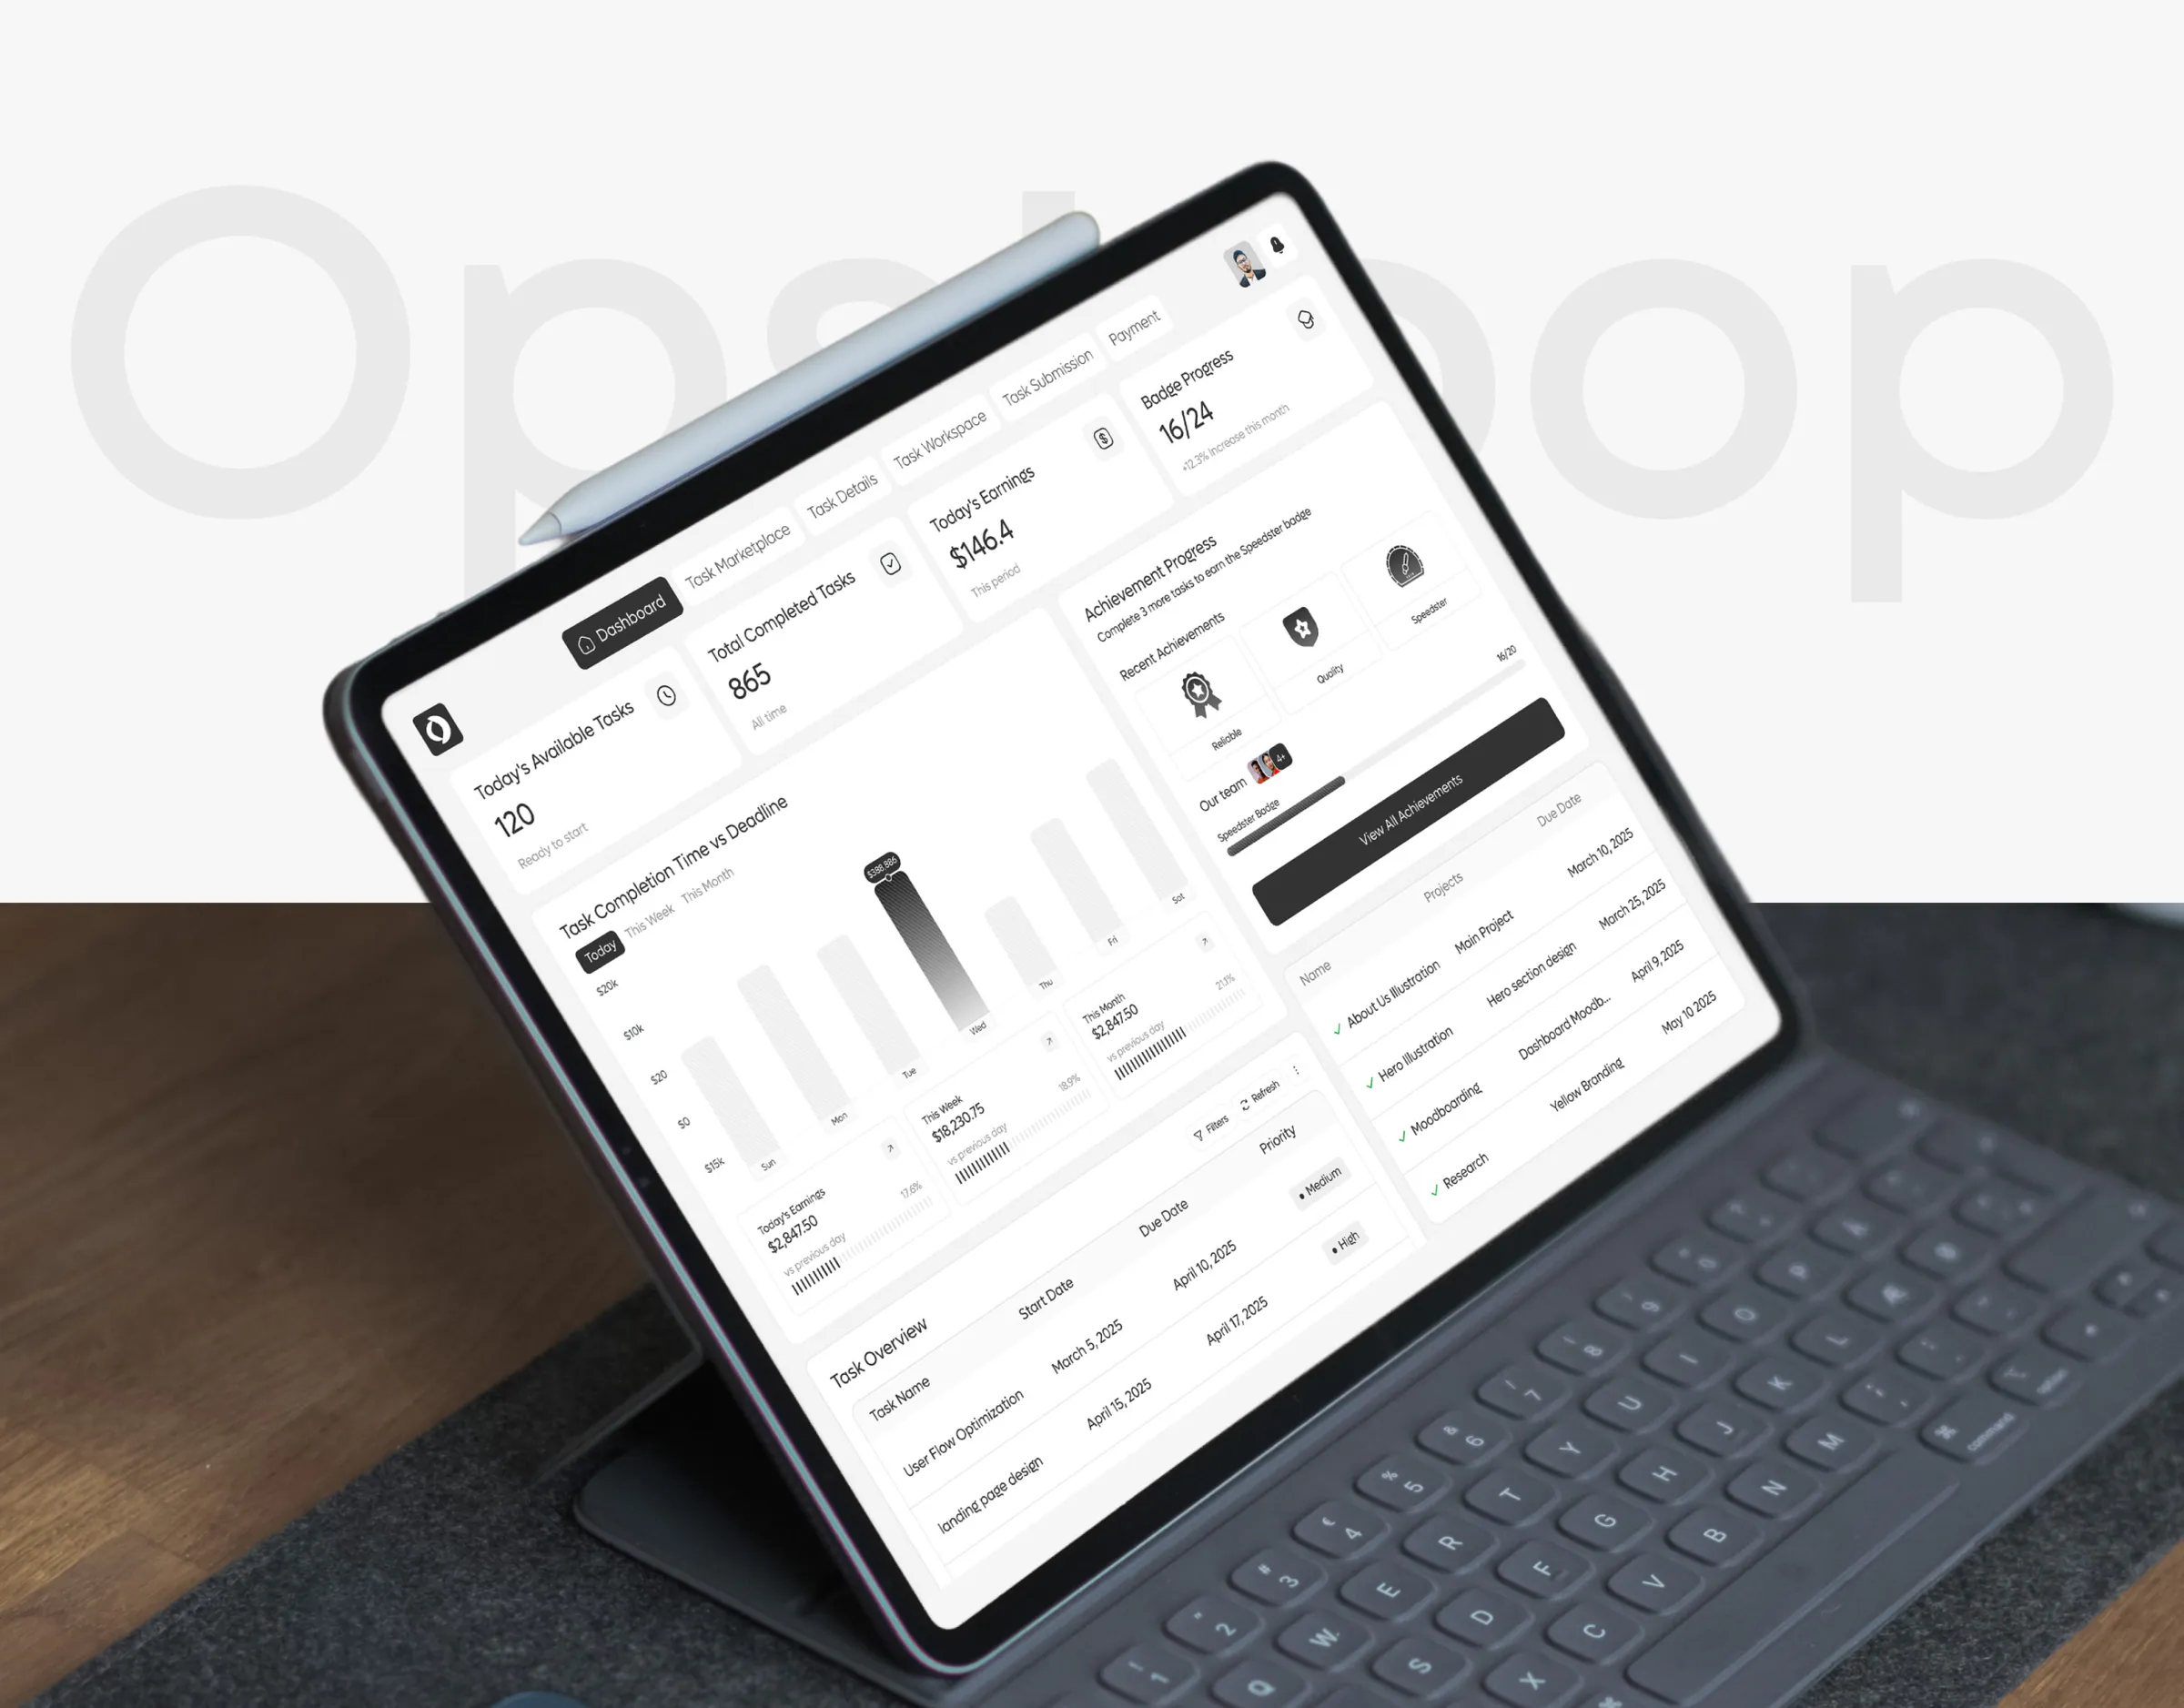
9. Running a task from posting to payment (OpsLoop)
Product: OpsLoop, a micro-task management platform. Goal: get work done and paid for, with quality checked.
- Create a task.
- Manage it while workers pick it up.
- Review the submitted work.
- If approved, pay. If not, send it back with feedback.
- See the result in reports.
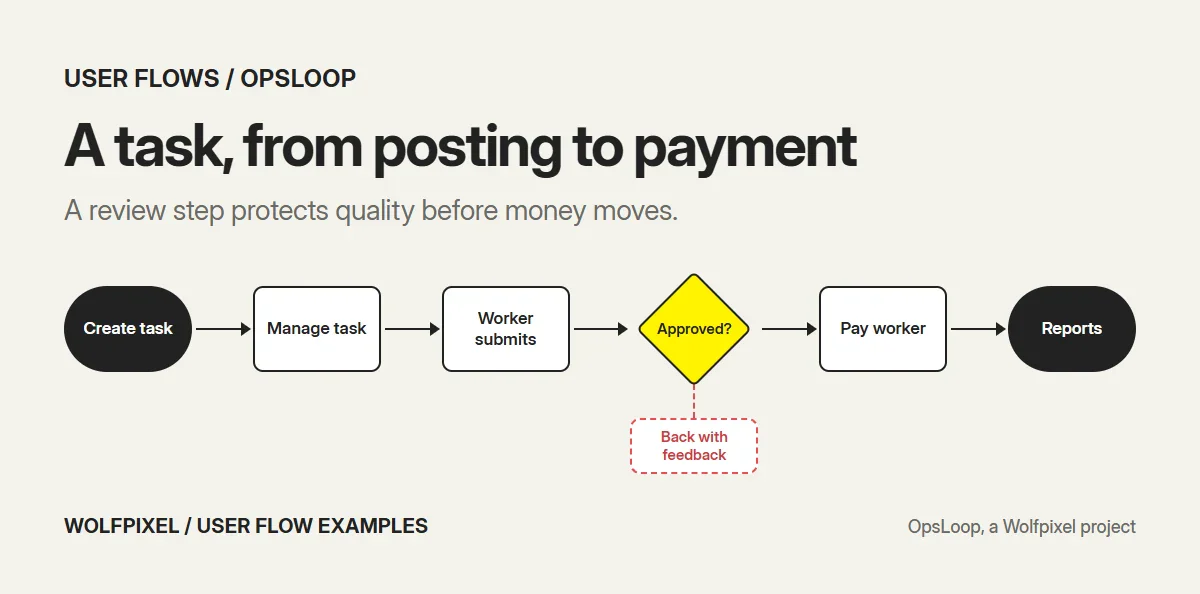
Edge paths to design: no worker picks up the task, a missed deadline, a budget that runs out. Metric to track: task cycle time from posting to payment.
10. Completing a task as a worker (OpsLoop)
Goal: find work, finish it and get paid.
- Open the dashboard: tasks available today, completed tasks and today’s earnings.
- Browse the task marketplace.
- Open task details.
- Do the work in the task workspace.
- Submit, then follow payment and badge progress.
Edge paths to design: a task taken by someone else first, a submission sent back for changes, a payment delay. Metric to track: tasks completed per active worker per week.
11. From website visit to trial or demo (Zyntra)
Product: Zyntra, an AI customer service SaaS website. Goal: understand the product and choose to try it.
- Land on the hero with Start Free Trial and Book a Demo side by side.
- Read how the product resolves a support request.
- Scan the feature cards, one promise each.
- Compare plans with the monthly and yearly toggle.
- Read the comparison table and FAQ.
- Start a trial or book a demo.
Edge paths to design: a visitor who needs an enterprise plan, a question the FAQ doesn’t answer, a visitor not ready to commit. Metric to track: visit-to-trial and visit-to-demo rates.
Website flows are user flows too. Putting both actions in the hero lets self-serve buyers and sales-led buyers each take their own path.
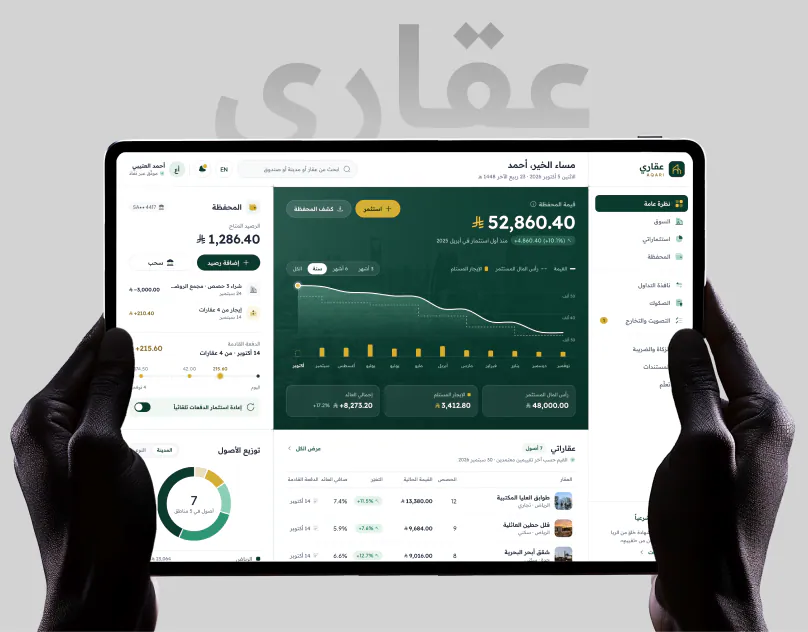
12. Onboarding a new investor with identity checks (AQARI)
Product: AQARI, a real estate investment fintech app. Goal: go from sign-up to a first investment.
- Sign up.
- Verify identity through Nafath.
- Complete the investor suitability check.
- Browse property cards showing funding, target return, net yield, minimum investment and days left.
- Invest from the 1,000 SAR minimum.
- Track portfolio value, wallet and payouts.
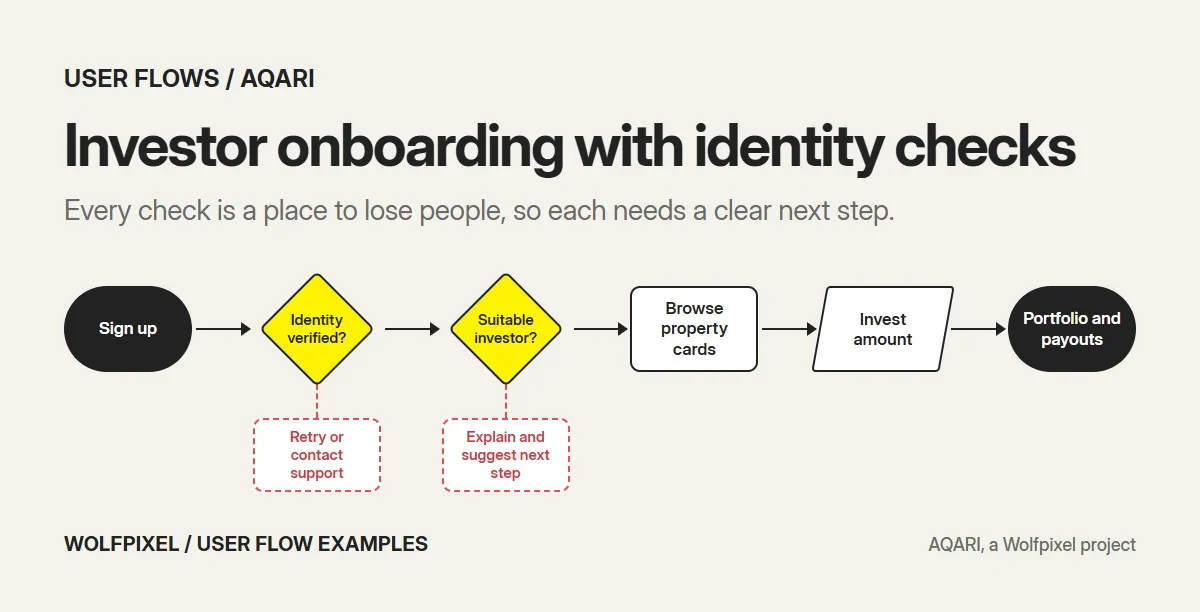
Edge paths to design: identity verification fails, the suitability check doesn’t pass, a property fills before the investment completes. Metric to track: sign-up to first investment.
On AQARI, the investor journey was mapped from first visit to first payout before the 32 modules of the product were organized. Regulated onboarding is where flows earn their keep: every check is a place to lose people, so each one needs a clear reason and a clear next step.
Web vs mobile user flows
The same task often needs a different flow on each platform.
| Web | Mobile | |
|---|---|---|
| Steps per screen | Several fields and actions can share a page | One main action per screen |
| Interruptions | Tabs and multitasking | Calls, notifications, app switching |
| Permissions | Rare | Camera, location and notifications need OS prompts |
| Re-entry | Bookmarks and links | Push notifications and deep links |
| Input | Keyboard and mouse | Thumbs, camera, voice, biometrics |
In practice, a mobile flow needs more save points and a plan for every permission prompt. In the RoomMind AI flow, for example, the photo upload step only works if the camera permission is handled well. Our guide on how to design a mobile app covers mobile edge cases in more depth.
How to turn a user flow into a funnel
A user flow tells you what should happen. A funnel tells you what does happen. Connect the two by giving every step in the diagram an analytics event.
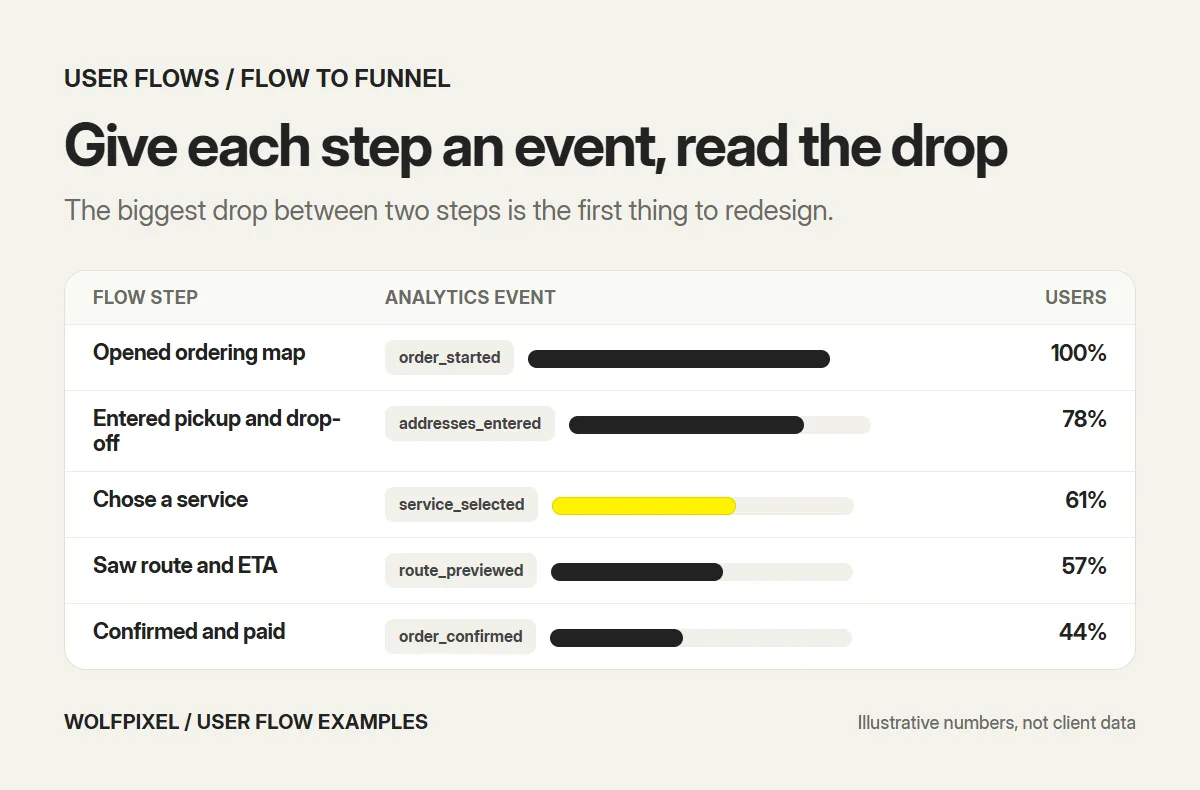
- Name an event for each rectangle and decision in the flow.
- Build a funnel from the entry point to the goal.
- Look for the biggest drop between two steps.
- Check the branches: how many users hit each error path.
- Redesign the step with the biggest drop first, then measure again.
If you already have a live product and don’t know which flow is leaking, that is what a UX audit is for.
How to create a user flow in 6 steps
- Pick one user and one goal. “A new patient books a first appointment,” not “patients use the app.”
- Define the entry point. Where does the user come from: an ad, a notification, the home screen?
- Define success. The exact state that means the goal is reached.
- Map the happy path. Every screen and action between entry and success.
- Add decisions and edge paths. Errors, empty states, permissions, timeouts and exits.
- Check it against reality. Compare with analytics if the product exists, or test a clickable prototype with users if it doesn’t.
The flows then become the base for wireframes and screens, which our UI/UX design process guide walks through.
Common user flow mistakes
- Happy path only. The flow looks clean and the product breaks on the first wrong password.
- One diagram for several goals. Split them. Each flow should end in one success state.
- Inconsistent symbols. If a diamond means a decision in one flow and a screen in another, nobody trusts the diagrams.
- No entry context. A flow that starts at “dashboard” ignores how people actually arrive.
- Drawing flows after the UI. Then they document decisions instead of shaping them.
- No metric. Without one, nobody knows whether the redesign worked.
For onboarding specifically, where most of these mistakes cost the most, see our guide to SaaS user onboarding.
Want your flows mapped?
We map user flows at the start of every UI/UX design, web app design and mobile app design project, before any screen is designed. If your product has a task people keep failing, book a free call and we’ll tell you which flow we would map first.
Sources and method
We reviewed every source below in November 2026.
- Nielsen Norman Group: User journeys vs user flows (2023), for the definition of a user flow and the difference from journeys.
- Nielsen Norman Group: Wireflows (2016), for the definition and origin of wireflows.
- Wikipedia: Flowchart, for ANSI and ISO 5807 flowchart symbol standards.
- Peter Morville: User experience design (2004), for the User Experience Honeycomb.
From our own work
- The 12 flows, from our case studies of Shipora, CareUp, RoomMind AI, Axon, Earnify, OpsLoop, Zyntra and AQARI.
- The edge paths and metrics, which are our recommendations for flows of each type, not results reported by those clients.
- The diagrams, drawn for this guide in one notation.
User Flow Examples FAQs
What is a user flow?
A user flow is a diagram of the steps a user takes inside a product to complete one task, such as signing up, booking an appointment or upgrading a plan. It shows the screens, the actions, the decisions and the error paths between the starting point and the goal.
What is an example of a user flow?
Booking a doctor in a health app is a typical user flow. The patient opens the app, searches or taps a specialty, compares doctor cards, picks a day and a time, confirms and sees the booked appointment. A complete flow also shows what happens when no slot is free or the payment fails.
What is the difference between a user flow and a user journey?
A user flow zooms in on the steps inside a product for one task. A user journey zooms out to the whole experience across channels and over time, including emotions and touchpoints outside the product, such as ads, sales calls and support.
What is the difference between a user flow and a wireflow?
A user flow uses simple shapes for steps and decisions. A wireflow combines wireframe-style screen layouts with flow arrows, so you can see what each screen looks like as well as how screens connect. Nielsen Norman Group notes that wireflows grew out of mobile app design.
What symbols are used in a user flow diagram?
Most user flows borrow standard flowchart shapes. A rounded shape marks the start and end, a rectangle is a screen or step, a diamond is a decision, a parallelogram is user input and arrows show direction. Many teams add a dashed line for error paths. Flowchart symbols were standardized by ANSI in the 1960s and later in ISO 5807.
How do you create a user flow?
Pick one user and one goal, define the entry point and the success state, map each screen and action between them, add every decision, error and exit, then check the flow against analytics or a usability test before designing the final screens.
What are the 7 pillars of user experience?
The phrase usually refers to Peter Morville’s User Experience Honeycomb from 2004. Its seven qualities are useful, usable, findable, credible, desirable, accessible and valuable. A good user flow supports several of them, especially usable and findable.
How many steps should a user flow have?
As few as the task allows, but no fewer. Most core flows have five to ten steps. Remove steps that only exist for the company’s convenience, and keep the ones that build trust or prevent errors, such as a confirmation before a payment.
What tools are used to create user flows?
Figma and FigJam, Miro, Whimsical and Lucidchart are common choices. The best tool is the one your designers and developers already use, because the flow should sit next to the screens it describes.
How do you measure a user flow?
Give every step in the flow an analytics event, then build a funnel from the entry point to the goal. The share of users who finish, the step where most leave and the time it takes tell you which part of the flow to redesign first.
Need your product’s flows mapped before you design?
Send us the task your users struggle with. A senior designer replies within 4 business hours with the flows we would map first and a fixed quote.

Was this article helpful?

Written by
Maniruzzaman Jubayer
Co-founder & COO | Product Design Specialist at Wolfpixel
Maniruzzaman Jubayer is Wolfpixel’s Co-founder & COO and a product design specialist with 7 years of experience. He personally oversees website, app, dashboard and digital product design at Wolfpixel, where user flows are mapped before any screen is designed. Every example in this guide comes from a product Wolfpixel designed. Wolfpixel offers the UI/UX design services discussed in the article.
View all articles